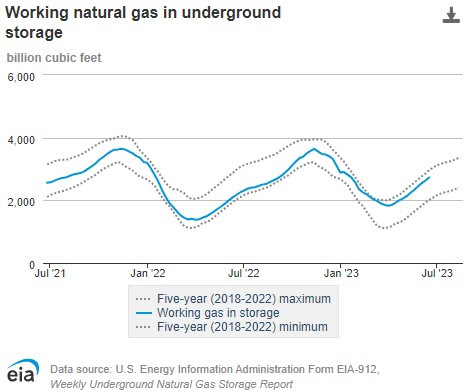
The Energy Information Administration released their weekly report yesterday.

Nationally, the inventory number continue to stay above the 5 year seasonal average.

The Pacific Region continues to gain, with last week's numbers, at -7.9% vs. -9.3% of one year ago. The 5 year seasonal numbers continue to improve.
In California, the price at PG&E Citygate in Northern California rose 57 cents, up from $4.32/MMBtu last Wednesday to $4.89/MMBtu yesterday. The price at SoCal Citygate in Southern California increased $2.24 from $3.40/MMBtu last Wednesday to $5.64/MMBtu yesterday. Natural gas consumption in the electric power sector increased by 84% (1.3 Bcf/d) in California and by 10% (0.3 Bcf/d) in the desert Southwest this report week
Select inventories of EU and UK...

Total EU rose to 82.53%, from last week's 78.63%.
It should be noted that Gas in storage does not represent usage. An Example would be Germany has 212+ TWH in storage, but consumed approximately 847 TWH in 2022, which was a 17% decrease from 2021.
The following contains pricing information, that is based in Mmbtu and converted to US dollars for comparison purposes only. Forex is used for this comparison and should be noted that actual exchange rates on delivery may vary.
Simply put... The EU and UK consumers do not use US Dollars, so be wary of these charts.


Snapshot of the past, the current and the future outlook for prices.

Just for comparison, the UK current pricing would suggest £1,522.06 per annum, while the 12 month high (FEB-24) would suggest £2,286.37. OFGEM has a cap around £2,047, which is line with the October futures.