The PCE numbers for January finally arrived yesterday, so the January numbers...

Nothing to extreme. I recognize much of February reportage has been completed, so the laggard is the PCE, which will see next release around April 9th.
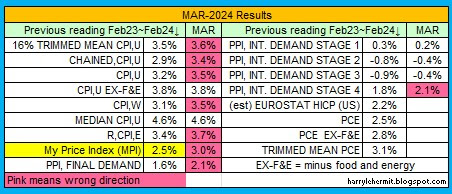
Obviously the CPI for February was 2.4%, and we can all expect that to jump for March. Energy prices alone, will drive inflation up by nearly a full percent, for the month of March. I would expect the overall y/y to be in the 3.2%+ range for March.

It should be noted that California prices will distort the national average. California is unique, due to nearly no access to the SPR (no pipeline, Jones Act), in direct competition with east Asia over Alaskan crude. Additionally, 30% of their crude imports ... comes through the Straits of Hormuz. California imports 60% overall.
Simple math indicates 18% of their refinery inputs are in serious danger of being impacted. It would not be unreasonable to see the pump prices in California breaching the June, 2022 highs. Gasoline- $6.438; Diesel- $7.011.
Natural gas prices are not substantially higher and should not increase due to the situation in the Persian Gulf. The reason being simple... The U.S. facilities for processing NatGas to LNG are already at full operation.
It is possible that various nation's SPR release might stem to spikes temporarily, but the capacity of withdrawal is one of the questions, as well as shipping availability. Ships can't magically appear overnight... at any given port.
Frankly, I see no easy solution.
Globally, Asian countries are very vulnerable, with the exception of China.
Curiously, Iran has stated that crude priced in Chinese Yuan would be allowed passage. China might gleefully go along with that, but considering the impact on the yuan/dollar exchange rate, as well as holdings in dollars held by China... maybe not.