Thursday, December 28, 2023

This Week in Petroleum Summary 12-28-2023, per EIA.GOV

A quick summary of this week's report.


Consumption continues to edge upward, although pump prices seem to be in a narrow range. There does not seem to be an upward bias in these prices, with the potential of -5¢ drop, which includes diesel.


Overall...

For those interested the exports of Crude, Petroleum Products, Including Gasoline has far outweighed the imports, by this much, since March, 2022.


That's a wrap for this week.


Friday, December 22, 2023

A Foray into the 2024 Presidential Election, Part VII

Onward I go into the endless fun of politics.

As stated previously, yes the polls are wrong, but in what way? Oddly, the polls that were wrong, were consistently wrong in both 2016 and 2020.

As can be noted, Arizona and Virgina were downright accurate. Georgia, New York and Washington near perfect, each with a very slight variance benefitting one party.

Some states had very poor polls to results variance. This could be attributable to a few factors...

  • Why would a democrat waste time on voting for a democrat candidate, in a heavily republican state?
  • Why would a republican waste time on voting for a republican candidate, in a heavily democrat state?
  • Why would a democrat waste time on voting for a democrat candidate, when victory is assured?
  • Why would a republican waste time on voting for a republican candidate, when victory is assured?
  • Perhaps the polling does not reflect the results, due to individuals hiding their true opinions, due to fear.
In any case, where polls have been wrong, they were equally wrong in both elections.

Wisconsin was a clear Clinton victory, until it wasn't. Wisconsin was an even more clear Biden victory, but it was downright scary close.

That same scenario played out in Pennsylvania and to some extent Michigan.

Naturally, some states are already decided, in my opinion. It is the so called battleground states that are intriquing.


When taking that information and reviewing the current polling composite...


Currently, the Locks and those Leaning, favor the Republican Candidate. The Democrat Candidate needs to hold Virginia, Minnesota and Colorado. Nevada(6) could be swung around, as well as Pennsylvania(19) and possibly Michigan(15), although not so favorable at this point.

That still leaves the need for one more state and it is hard to make a case for any, based on past polling discrepancies.

That is why so much concern is emanating from the Democrat party.

As to Colorado and the 14th amendment. I guess the courts will decide, but whether Trump is on the ballot or not, Colorado's 10 EVs are still Blue. Just as they would, for several other states attempting to jump on the bandwagon. Same could be said for Red states.

Keeping someone of the primary ballot does not mean keeping them off the general election ballot.

Makes for great theater and the clickbait media coverage is in full swing.

Whether any of it amounts to anything, is yet to be seen.

Merry Christmas!

Review of November 2023 data, GDP, PCE and personal income

 I'll try not to harp about this too much. The BEA switched from 2012 dollars to 2017 dollars for 3Q23, and adjusted prior data. I download all such reports, so I can easily tell the difference.


The trade deficit is a drag on GDP, thus in the 2Q23 original report, that drag was -5.95%. As of right now, after those adjustments... the drag is-4.14%. Quite an improvement. The stated +4.9% GDP is a catch up to what can only be viewed as under-reporting of previous quarters. 

How that change affects going forward, is uncertain to me. Given the wide array of expectations for 4Q23, I am thinking not everyone is on the same page. I am done harping about this.

Now on to the PCE report, after reviewing adjustments...

Yes, inflation is slowing, not deflating, with the exception of gasoline, which looks to have stopped falling.

The monthly summary...

All in all, a pretty good monthly report card. I do think the market is making too big a deal on expectations of the FED cutting rates before summer, but what do I know?

Wednesday, December 20, 2023

Comparison of Inflation in selected countries- December, 2023 Edition

With the United Kingdom, Canada and EUstats release of November data, I have updated my comparison graph. [Note, the USA(EU method) is directly from Eurostat.]


For those individuals unable to think on their own and unable to question their masters, here is a timeline in rebuttal to the everyone has inflation. Look at the above chart to consider the timeline and now look at the below chart...


The EU method of calculating inflation is used, to better gain an apples to apples comparison. Yes, that line on top is U.S. inflation running well ahead of the EU and UK, or (sadly) what the your masters consider the rest of the world in U.S. political speak.

Geez!!!


This Week in Petroleum Summary 12-20-2023, per EIA.GOV

Another week, and another set of charts summarizing things from the Energy Information Administration...


Consumption of gasoline is easing upwards, although may slide after Christmas. The prices are below this time last year, but are likely to edge up following Christmas... just like last year. (They have edged up the past two days.)


Overall...
For those interested the exports of Crude, Petroleum Products, Including Gasoline has far outweighed the imports, by this much, since March, 2022.


That's a wrap for this week.

Thursday, December 14, 2023

My electricity bills over time (December 2023 Edition)

It's December and the monthly bill has arrived.


As always, weather is a factor in consumption, which is why a rolling average is also important. Currently, that 12 month rolling average is -2.4% below last year. 
[I suspect it might continue to be lower, as I altered the thermostat settings in December of 2022. I adjusted the nighttime heating settings from 68°F to 72°F, which would increase the usage in winter time. Daytime heat settings remained at 72°F.

Cooling settings remain at 76°F daytime and 72°F for nighttime. Additionally, the number of days between meter readings vary.]

The conclusion at this point, is this year's electricity bill is running -2.7% below last year. THAT is a good thing. 😀

To put my in perspective the average family spends $160.22 per month on Electricity. They also, spend roughly $2,600 on gasoline per year, whereas I spend roughly $200.

The point being, I am not average. None of us are truly average... we are above or below in most things.


A Foray into the 2024 Presidential Election, Part VI

Here we go...

Trump currently holds a 44.9% to 42.7% lead in the polls. Of course the polls are always wrong, even though Biden led from the start in 2020, although the start was in spring of that year... so a bit to go.


The current problem is Biden is not only trailing in nationwide polling, but in those "toss-up" states. A long haul at the moment, imho.

This is the current outlook, when adjusting for polling discrepancies in the last two elections. 


12-15-23, Advance Retail Sales Report for November Data

Advance Monthly Sales for Retail and Food Services, November Report.

First up should be the revisions...


Note the -0.2% downward revision in October's numbers and as always, remember this data is NOT inflation adjusted. Now onto the current report...
Advance estimates of U.S. retail and food services sales for November 2023, adjusted for seasonal variation and holiday and trading-day differences, but not for price changes, were $705.7 billion, up 0.3 percent (±0.5 percent)* from the previous month, and up 4.1 percent (±0.7 percent) above November 2022.

The inflation adjusted chart looks like this...


It is hard to capture from the graph, but "Real" sales are advancing very slowly since January, although still below 2022 average levels. Year over year, up +0.8% inflation adjusted, with the month being up +0.5% after inflation adjustements. 

So it can be called a win.


Wednesday, December 13, 2023

This Week in Petroleum Summary 12-13-2023, per EIA.GOV

Just some charts to summarize today's report...


Prices continue to fall and could challenge the December 23rd, 2022 low of $3.096... In fact it is more than possible, imho, as I would currently project $3.072.

But, I think we are nearer the bottom of the seasonal gasoline price dip. Maybe a good time to top off the tank, imho.


As for the overall summary...


Not sure what the ruckus is about, regarding that crude draw. 


Producer Price Index December release November 2023 Data

The BLS has released the November Producer Price Index Report (historical releases)

The Producer Price Index for final demand was unchanged in November, seasonally adjusted, the U.S. Bureau of Labor Statistics reported today. Final demand prices decreased 0.4 percent in October and rose 0.4 percent in September. (See table A.) On an unadjusted basis, the index for final demand increased 0.9 percent for the 12 months ended in November.

In November, the indexes for both final demand goods and for final demand services were unchanged. 


Final demand goods: The index for final demand goods was unchanged in November after dropping 1.4 percent in October. In November, price increases of 0.6 percent for final demand foods and 0.2 percent for final demand goods less foods and energy offset a 1.2-percent decrease in the index for final demand energy.

Let's revisit that paragraph. What did the -1.2% decrease in the index for final demand energy... offset?

Within final demand goods in November, prices for chicken eggs jumped 58.8 percent. The indexes for fresh fruits and melons, utility natural gas, electric power, and carbon steel scrap also moved higher. In contrast, prices for gasoline fell 4.1 percent.

So gasoline (-4.1%), which is typically moving into seasonal lows, is the reason for that -1.2% decrease, which offsets a bunch of rises in food (+0.6%) and other energy components. 

Not to nitpick, but if gasoline is having that impact, and is moving into seasonal lows, which might continue through the December release... could reverse beginning after Christmas, just like last year.

For those of us that like to eat food, that annualized 7.2% increase in food is going to weigh on the budget of many of us, unless we decide to eat less and lose "weight".

Tuesday, December 12, 2023

BLS Data Dump. CPI - December 12, 2023

First up is the BLS Report for CPI...(historical releases)

The Consumer Price Index for All Urban Consumers (CPI-U) increased 0.1 percent in November on a seasonally adjusted basis, after being unchanged in October, the U.S. Bureau of Labor Statistics reported today. Over the last 12 months, the all items index increased 3.1 percent before seasonal adjustment.

I think the numbers were somewhat in line with everyone's expectations.

I do find the food portion of the darn thing a bit intriguing.


While the overall index has increased 17.4% since January, 2021, the food at home index has jumped 20.3%

Oddly, when adjusting the index to "average" household spending the food at home has jumped 29.6%, in current dollars.

What really catches the eye, is the -8.5% drop in current dollars for food away from home. This would be cafeterias, restaurants, and other places "away" from home.

This type of comparison with weightings against the index, further indicates a drop in current dollar spending for food in all categories... compared to rate of inflation.


The CPI index has an increase in prices of 20%, yet current dollar spending is 11.6%. The food away from home industry is not keeping up, as I suspect more meals are prepared at home... or people are cutting back on eating. [NOT]


Real average hourly earnings for all employees increased 0.2 percent from October to November, seasonally adjusted, the U.S. Bureau of Labor Statistics reported today. This result stems from an increase of 0.4 percent in average hourly earnings combined with an increase of 0.1 percent in the Consumer Price Index for All Urban Consumers (CPI-U).

Here is a graph...


Tis a nickel better than February, 2020. Merry Christmas!


Thursday, December 7, 2023

A Foray into the 2024 Presidential Election, Part V

Here is another stab at the 2024 election. Trump appears to be ahead with polling numbers of 44.1%. compared to Biden's 43.3%. Very tight indeed, until polling of individual states relative to electoral votes is considered.

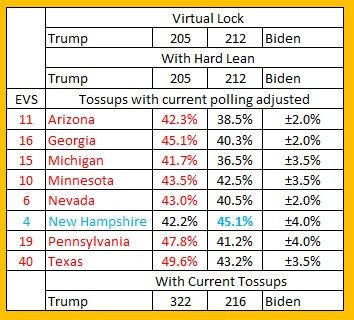
Took a hard look at the virtual locks, in regards to electoral votes, which resulted with Biden having 212 electoral votes locked up, and Trump with 149.

When I say "locked up", I am referring to places like California, Alabama, Arkansas, Delaware, etc. It should be obvious whether they are blue or red. So stencil them in.

However, in 2024, there are some hard leans, as well.


Florida has Trump with a 9 point lead in the polls. Consider where the polls were in 2016 and 2020, the compare to results. That 9 point lead is significant. 

Again, Georgia was not really that far out of whack in the 2016 and 2020 polls, so the polls for this year having Trump with a 7 point lead... is quite meaningful.

That trend continues with the other "hard leans" listed, which results in Trump holding a 251~216 lead at this point.

So Trump just needs 19 of 71 remaining EVs. The opposite of that... Biden needs 54 of the remaing EVs.

Turning it around might be possible for Biden. 

However, Ukraine is still an issue on his watch, as well as that Middle East mess. Not seeing any upward lift being provided by those.

Economy, could be an issue, but not a lot of upward lift to be seen in this area. Sure, GDP was up 5.2% annualized, but don't forget a massive adjustment was just undertaken, by moving the numbers from 2012 dollars... to 2017 dollars. I alluded to this in a previous article.

On January 25, 2024, the BEA will likely report something in the 1.5%~2.0% annualized GDP growth. A lot of whining will take place about how the economy has gone from robust to anemic. Both are rather silly, but the resultant public opinion will not likely provide any huge boost for Biden.

That report will be followed about 3 weeks later, with the CPI report for January.

There is the inflation issue, of which will be largely cheered with both the November (DEC release) and December (JAN Release) data releases. Both of which will indicate a shallowing month to month rate of inflation.

However, both months will be a result of significantly lower gasoline prices, which is a seasonal norm. While making up a small percentage of consumer spending, the impact will be enough to bring month to month to zero and very likely negative. 

Once again, that news turns south with that February release of January's CPI data. Why? Those falling gasoline prices will be in the rear view mirror, and will be rising... We are getting into the heart of political silly season by then.

Frankly, rising gas prices will bring out the grocery prices are much higher crowd. It may well be, but this is about the attitude of voters... which won't be uplifting for the Biden campaign. Voters tend to remember things from days past, when they look at the grocery receipts and those numbers on the gasoline pump.

So not a lot of upside going forward, imho... for a Biden rebound.

Remember, the perception needs to change for Biden to reverse his current dismal ratings.

Wednesday, December 6, 2023

This Week in Petroleum Summary 12-6-2023, per EIA.GOV

Just some charts to summarize today's report...


Prices continue to fall and could challenge the December 23rd, 2022 low of $3.096... In fact it is more than possible, imho.

That's a wrap!


Tuesday, December 5, 2023

A Further Review of 3rd Quarter, 2023 GDP... just for fun!!

So yes, the GDP was revised to 5.2% annualized, from 4.9% annualized. That does not mean the economy is robust. It's not bad, but robust is a bit of hype for politicians.

The BEA moved from 2012 dollars to 2017 dollars for the 3rd quarter releases and going forward, until next change in... say 5 years.

In theory, it should have been even across the board, after compensating for 5 years of dollar value adjustments, etc. Such as inflation being about 7.5% during that 5 year period.

If only there was someone, somewhere that downloads those excel spreadsheets from each GDP iteration.

Voila...


Note the column headings for 2012 dollars and 2017 dollars AND the % Change. The changes were clearly not uniform across the various groupings.

While there was a 9% upward adjustment, several groupings failed to match that rise, including some that went negative... while others outpaced the 9% reading.

So in theory, all the numbers going back in time were revised to reflect the current situation. But again, that was very uneven. Just consider the trade deficit, which is a drag on GDP... and those changes.

All in all, it did distort the 3rd quarter readings and possibly provided a misleading annualized number. That would be no big deal... if not for an election year and people willing to make everything political. 

While the current 5.2% annualized is being hailed as something significant, I wonder what will be hailed, when the 4th Qtr. 2023 is revealed on January 25th, 2024. My guess is way below that 5.2%. Back to the 2.0% annualized, or even lower!  

One can imagine the hysteria over such falling numbers, but the adjustment was improperly attributed to a "robust" economy.

So remember... the trade deficit, which is a drag on GDP was revised dramatically lower, after the BIG change for 2012 to 2017 dollars. That trade deficit adjustment was about 100% of that 5.2% annualized, or ±0.1% annualized without that lone adjustment.

You think I might be off my rocker! The current Real GDP rolls in at 22,506.4B, which is a hefty 281B above the 2nd qtr. figure of  22,225.4B. Now take a look at that downward revision of the trade deficit,  -284B. 

Remember the trade deficit is a drag on GDP, so a downward revision in the Trade deficit would result in a higher GDP print. IF the GDP had not been revised downward by -284B, then that +281B gain in GDP would evaporate. As in +0.1% annualized.


Oh well! It is just numbers and you can believe what you want. However... that adjustment was one time only, for the time being and 4Q23 will be significantly lower, imho. How does a drop off from +5.2% annualized to say +1.7% annualized look in an election year. 

One group will claim the economy is crashing into a recession, another group will be saying soft landing is working, and another group will be screaming the FED must cut rates rapidly.

I then ask you, if stating the 3Q23 was actually 0.1% and the 4Q24 was +1.7%, would indeed indicate a possible soft landing. Of course, the groups would likely being crying the same thing... just 3 months earlier.

It is fun to watch all the spin!

Saturday, December 2, 2023

A Foray into the 2024 Presidential Election, Part Four

Here I go again, delving into the rabbit hole of politics and polls.

The polls are wrong, as we all know. 

In 2016, Clinton was leading Trump in Wisconsin by 5 points, yet lost the state.

In 2020, Biden turned it around and led by 9 points in the polls, yet barely won the state by 20,000 votes or 0.6%

Granted Clinton only had a 2 point lead in Michigan, ahead of the election and lost by a slim margin. Once Again, Biden turned it around by having a 9 point margin, before finishing 2.8% ahead.

In 2016 Clinton had a 2 point lead in Pennsylvania, before losing that state. Again Bided turned it around with a 5 point lead, and winning by a slim 1.2%. A win is a win.

Florida was a deadlock and then the election of 2016 had Trump up by a slim 0.8%. Biden had a 3 point lead in Florida for 2020, yet Trump won by 3.3%.

Again in 2020, Biden had a 1 point lead in Texas, and it was widely assumed Texas was turning blue, except Trump won by 5.5%. It was tighter than 2016, so maybe turning blue, but not just yet.

Of course some states matched the poll numbers, such as Georgia. Almost nailed it in 2016 and 2020. 

Arizona was near that match for both years, as was Nevada and some others.

I suppose there are many reasons, such as 3rd party candidates, undecided voters, no shows, etc.

So having gone down the rabbit hole of reviewing the 2016 AND 2020 polls by state... I have come up with my own darn formula.


Yes, you saw that right. Trump has an edge at this point in time. Biden needs to focus on the slights and get them back in the fold...
Amazing that Minnesota is in the mix, but the indications are there. Then there are the marginals for Trump...

Biden needs to swing 27 Evs back from these. Any two will do, So along with Arizona, Minnesota and Nevada... 2 more.

Remember Arizona and Nevada seem to match polls with election results. So does Georgia.

Not that a swing back couldn't be accomplished, but most of these states have polled poorly for democrats, when compared to general election.

That took up way too much of my time, so that's it for now.

Friday, December 1, 2023

My Analysis Methods Regarding CPI and Weightings.

I was prompted recently, by the uproar of the inflation data and CPI "hiding" information. I think the information is there, but a lot of folks don't bother to read past the headline.

An example would be the food component.

To understand my recent research, understand an article was written by a mainstream media source that stated... the typical American family must spend $11,400 more now on the basics, compared to January of 2021. They cited the BLS data.

So the January 2021 BLS report, had the print at 261.582. The October 2023 BLS report, rolled in at 307.671. Overall, it shows inflation rose 17.619%, during that period.

If that family is spending $11.4K more, then they were spending at an annual rate of $64,700, in January 2021, compared to a current rate of $76,100. A difference of $11.4K or 17.619%.

This is the basic CPI print for food total, food at home, and food away from home...

Now that those conditions are understood... onto the weightings.

This is what happens, when the weightings are thrown into the mix...


Note that food overall is much less at 11.4%, than the first chart's 20.2%. However, food at home jumps to 29.4% from the former chart's 20.9%. Oddly, the actual food away from home spending has fallen -10.7% since January 2021.

We are spending much more on food at home, than the BLS numbers indicate. It is due to fluctuations in weightings. These fluctuations are found in almost, if not all... categories.


Review of March 2024 data, 1Q GDP, PCE and personal income

The monthly summary is not so wonderful, incomparison... Inside all that pink is some troubling food related issues. Even though energy is s...