Showing posts with label PCE. Show all posts

Saturday, August 16, 2025

Week Ending Report-August 16th, 2025

A few reports of interest (to me), from this past week.

CPI

Real earnings

Petroleum

Producer Price Index

Retail Sales

The inflation report was rather benign and met expectations. The oddity was in the CPI-W, which directly relates to C.O.L.A. It was a mild 2.5% y/y. The previous projection was a 2.6%~2.7% cola, which now moves a bit down to 2.5%~2.7%.


The Real Earnings moved up and is +1.2% above one year ago. As this is inflation adjusted, the earnings are +3.7% above one year ago.

The petroleum report shows an increase in both crude and distillate supplies. Gasoline supply edged a shade lower.


Produce Price Index was rather ugly, with a substantial jump across the board. Just as last month's PPI foreshadowed a benign July CPI... August will be a wake up call, imo. On top of that, the forecast for PPI is even higher... going forward.

I am not exactly happy, as my current CPI is 3.0% and possibly climbing, with COLA far behind.

The current status of the report card...

Advance Retail Sales


Not a bad report on the surface.

OPINION time:
In a previous post I questioned the accuracy of some government reports. The retail sales would be one example. The issue being with revisions. Below is a snapshot of cumulative revisions of advance sales going back about 2 1/2 years. Revisions are not unheard of, but the pattern is suggestive of something being off. 


The pattern HAD been the previous couple of months being revised downward, which inevitably shows a brighter current report. This had been almost a monthly occurrence, of the past couple of years. Now it should be noted that historically, April has been an across the board revision of everything.

Going forward, it will be interesting to observe if the revision pattern continues, although the monthly pattern has broken towards upward revisions for previous month's data, which would suppress the joy of a current report. It does seem suspicious, imho.

While the overall picture seems okay, with the exception of the PPI... a glimmer of hope seems to be in the PPI being a month blip, as following forecasts indicate flat to negative.

Saturday, August 9, 2025

Week Ending Report-August 9th, 2025

A few reports of interest (to me), from this past week.

Trade Report

Petroleum Report

The international trade numbers are self explanatory in the linked report.

As for the petroleum report, usage of gasoline continues to drift downward, with pump prices in a narrow range. 


There is the potential for a hurricane in the next couple of weeks, but it is largely forecast to be near the east coast and not the gulf coast, or whatever you want to call it.

OPINION time:

Barely any movement in inflation expectations, although a slight move upward from now into the 4th quarter is in the offing. 

3rd Qtr. GDP projections remain positive, although barely, with 4th quarter in the same range and an uptick by first of year.

I guess if I were a president of a country at war and had suspended elections, knowing I wouldn't be re-elected... I would likely resist any form of peace, even if my citizens continued to die. Especially if the fighting was supported with foreign tax dollars... whether directly or through military munitions.

Saturday, August 2, 2025

Week Ending Report-8-02-2025

A few reports of interest (to me), from this past week.

GDP

Personal Income and Outlays

Weekly Crude Oil Report

The GDP exceeded forecasts, but not really by that much. It was just as much about the trade and services deficit, as was the first quarter negative. 

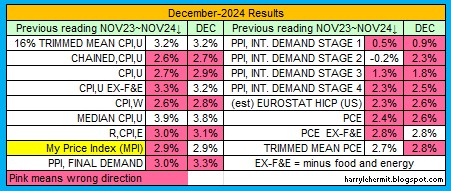
Personal Income and outlays was mostly positive. Here is the July Report card, which includes several variables.


A lot of pink, which is inflation heating up, but oddly... the PPI seems to be slipping. So maybe inflation is cooling. 

Also, of note... the report card was not updated to PCE revisions for prior months.

Here is the latest...


Here was previous month, with revisions highlighted...
There are always some revisions of Government numbers, but the past few years have been quite noticeable, imo. More on my opinion later.

The petroleum report continues to astound me, as U.S. consumption is well below last year.


OPINION time:

The firing of a government official in charge of employment numbers caused great gnashing of teeth. I have a different view than some of the current pundits. 

Those employment numbers have been suspect for some time. The past few years have seen monthly reports heralding better than expected hiring, with hardly any mention of prior months downward revisions. 

The aforementioned was a near monthly occurrence, with even a massive one time downward revision for several months prior... again without media comment. It was very hard to ignore the possibility of political intervention. And if not political intervention... then very lackluster data collection, of which improvement is much needed.

I should probably mention that many reports from the government are in constant revision stage. Contrary to public opinion... I consider the inflation reports to be the most accurate and reliable. The employment numbers being the least reliable. The rest fall in between those two, imo.

Friday, January 31, 2025

1-31-2025 Week In Review

Energy

Crude inventory up a bit, with distillates down, and gasoline up. SPR up a bit. Price at the pump has barely budged and should continue in a narrow band.

Politics

It is the same old, same old. It was funny, but is now getting boring. Example: When there is a school shooting, we know what is said immediately by both sides. A plane crash provides us with the same dynamics, but in opposite polarization. 

Unfortunately, there is a history regarding this issue, dating back to the Obama presidency, which is in the courts since 2014 and is still not resolved, as of 1-29-2025.

BRIGIDA v. UNITED STATES DEPARTMENT OF TRANSPORTATION

GDP

Annualized at 2.3%. Personal Consumption Expenditures were up dramatically.


While the 4th quarter jump in personal consumption expenditures is not entirely unheard of... I do wonder about the enormous jump in this past quarter and whether I am able to believe it... which I consider a bit shady. 

One possible explanation of this large jump is people buying ahead of potential tariffs. This is solely based on social media posts, which have people talking about buying stuff now, rather than later. Of course, these are social media posts, which are about as believable as... the GDP numbers.

Of course, if those posts are indicative, then the later buying will not take place and personal consumption expenditures will slow considerably in 1Q2025. Of course, politics will come into sharp view. Or rather sharper view.

PCE Report


Considering the target is 2.0%, The FED is okay with a number above that, as they left rates unchanged. Clearly there is concern for inflation, but there are some troubling signs... regarding the economy.

The Snow has almost melted.

Almost, as it has been 27 days and the temps are expected to be near 60 for a couple of days, and above freezing til the 9th.

End of the line

I am getting so bored with the current news cycle. I think it is time to simply blog, when there is something of interest.

Also, I have had adsense running and think it is time to remove adsense from this blog. I am the only person interested, so it makes more sense to cut adsense. My reasons for adsense were mostly to understand the audience, but since there isn't any... there you go. Besides, there never was any meaningful knowledge to gain, that was not already present under stats. 

Also, I always checked from my home screen and never really looked at the end product on line. I recently checked and clearly, I do not know how to properly place ads. It is rather embarrassing.

Adios!

Friday, September 27, 2024

Review of August 2024 data, 2Q GDP, PCE and personal income

The monthly summary continues to improve, although PCE ex food and energy inflation numbers continue to be a concern.


A lot of hoopla about the overall, but that PCE ex-F&E edged upward.

Now for the revisions in previous months...


Personal income, etc. is shown here.

The GDP 3rd estimate can be found here.

Note the uptick in the trade deficit. A part of that may be the front loading of imports in preparation of possible East and Gulf Coast port strike, possible on 10-1. Both sides seem to be playing chicken at this point. Each day of a strike would in theory... hamper $4.5 in imports and $2.8B in exports. 

That front loading should likely have a bit of drag on 3rd Quarter GDP, but certainly not like the 1st half of 2022... which was almost entirely responsible for those back to back negative quarters.

By end of October, we will have the first glimpse of 3Q GDP and whether there was a strike.

Friday, August 30, 2024

Review of July 2024 data, 2Q GDP, PCE and personal income

The monthly summary continues to improve, although PPI numbers continue to be a concern... going forward. 


Regarding personal income, etc., read here.

The 2nd quarter GDP was revised upward. I was puzzled by the statement regarding consumer spending and thus the headlines of resilient consumers. I would have expected consumer spending to be at or above the overall GDP announcement. 

But that is just me. It is an election year and important to convince the consumers... they are doing well.

Oh Joy!

Friday, July 26, 2024

Review of June 2024 data, 2Q GDP, PCE and personal income

The monthly summary continues to improve, although PPI numbers continue to be a concern... going forward.


Regarding personal income, etc., read here.

The 2nd quarter GDP came in above expectations at 2.8% annualized. I was puzzled by the slower growth in Services at 2.2% annualized, which helps explain the 2.3% annualized for personal consumption. Durable goods up 4.6% and nondurables at 1.4%, both annualized.

Overall a good report, but I would be a bit concerned if fixed investment can continue its expansion, which is equipment driven, while inventories keep building.

As for the PCE excluding food and energy... not much movement. Granted the market is anticipating a rate cut in September... and it might be warranted. A string of rate cuts might not be so warranted, imho. 

We can start the cycle again for next month, with the likelihood of CPI being at or slightly above this past month's reading. 

Friday, June 28, 2024

Review of May 2024 data, 1Q GDP revisions, PCE and personal income

The monthly summary continues to improve, although PPI numbers are of concern... going forward.


Regarding personal income, etc., read here.

The GDP for 2024Q1 was revised ever so slightly upward to 1.4% annualized. Only time will tell if that gets revised on September 26th.


Friday, May 31, 2024

Review of April 2024 data, 1Q GDP revisions, PCE and personal income

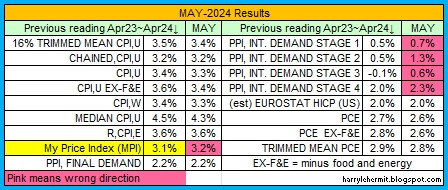
The monthly summary is not so bad, actually.


The best that can be said, is inflation has stabilized, with a further slowing in the cards, by end of the year.


What is striking, is the downward tilt in disposable income AND personal consumption expenditures.


If you carefully look, the previous month was also revised downward, for those two items.


If spending is slowing, it would follow that demand is slowing, which would/should... slow inflation going forward.

As for the GDP revision... it was not unexpected. The story has now become the service sector. Not terribly worrisome, but what caught my eye, is the trade imbalance, which jumped. 

Oh well, that's a wrap for May.

Friday, April 26, 2024

Review of March 2024 data, 1Q GDP, PCE and personal income

The monthly summary is not so wonderful, incomparison...


Inside all that pink is some troubling food related issues. Even though energy is somewhat in a narrow band, the food outlook is upward. The CPI-U expectations for the report on April, seemingly indicates a repeat of Mar-2024, outpacing the monthly core, although core is expected to ease a bit. Still above the overall CPI-U.


As for the personal income arena... this is the link... https://www.bea.gov/news/2024/personal-income-and-outlays-march-2024


There seems to be quite a jump in spending, versus Disposable personal income... for 2 consecutive months. Not sure there was much cash on hand, so the disposable is likely in the form of additional debt. 

Of course the above report mentioned a rise in goods. Perhaps it did, but the 1Q GDP did not reflect that. 

As for GDP, it now stands at 1.6% annualized for 1Q2024. The Trade deficit loomed large in the quarter and shows no signs of abating.

The reports for the month, ended up in so-so territory, imho. I am sure it will get spun hard in each direction. 

Friday, March 29, 2024

Review of February 2024 data, 4Q GDP Revision, PCE and personal income

The monthly summary...


The overall PCE edged upward, on annual basis, with PCE ex food and energy staying flat. 

Of course, the official got revised up for January, which indicates a difference from my report...


As for the personal income arena... this is the link... https://www.bea.gov/news/2024/personal-income-and-outlays-february-2024

Note the revisions as always, and I would recommend tracking the data monthly. Revisions are normal part of the cycle, as more data comes in. Recently however... previous data seems to come in a tad lower, which results in inflated current estimates. This was not always the case.

As for GDP, it seems to have edged up for 2023-4Q. I am not going to beat that horse over trade deficit numbers. I will simply state that prior to transfer of data from 2012 dollars into 2017 dollars, the GDP was marginally better. That adjustment amounts to about 1.9% annualized. So just take that with a grain of salt, as it is just my opinion.

One remaining bit of info can be found here. While I might harangue about the national debt, the 2023 year end net international investment was released. UGLY, at almost $20T. THAT IS WHAT WE OWE OTHER COUNTRIES.

https://fred.stlouisfed.org/series/IIPUSNETIQ


Thursday, February 29, 2024

Review of January 2024 data, 4Q GDP Revision, PCE and personal income

The monthly summary...


The downward shift in inflation continues across the board, with the exception of my price index, which is more about healthcare than any other weightings.

There were modest revisions in the PCE report, which are highlighted in Red.


I have made much of government spending on the GDP, but historically... not so abnormal (all charts from 2000Q1 onward...


A bit grainy in the upload, but trends are evident. The worrying factor is the trade deficit, while showing a bit of improvement the past few months, is still staggering compared to 10 years ago.

Bored silly, so will leave it there. 


Monday, January 29, 2024

Review of December 2023 data, 4Q GDP, PCE and personal income

Alas, 2023 reports have concluded. The GDP's 4Q advance reading indicates a sterling 3.1% rise. I will make mention of the 5 year Quinquennial revision from 2012 dollars to 2017 dollars. As would be expected the numbers jumped 9.0%. I can't help but notice the big drag on GDP of net exports of good and services, slid a whopping -26.7%

Even under the revised numbers, that latter component fell another -5.9% from one year ago.


PCE, which is typically 68.7% of GDP under the 2017 revision, made up 58.3% of that yearly increase. 

Which gives pause to the notion of the consumer driving those GDP numbers, when in fact they appear to have been a bit of drag.

Gross private investment, also underperformed. The real over achievers were government and net exports of good and services. 


It is what it is.

PCE ex. food and energy ease from 3.4% to 3.2%. The overall remained unchanged.


All in all, a decent end to the 2023 years.


Friday, December 22, 2023

Review of November 2023 data, GDP, PCE and personal income

 I'll try not to harp about this too much. The BEA switched from 2012 dollars to 2017 dollars for 3Q23, and adjusted prior data. I download all such reports, so I can easily tell the difference.


The trade deficit is a drag on GDP, thus in the 2Q23 original report, that drag was -5.95%. As of right now, after those adjustments... the drag is-4.14%. Quite an improvement. The stated +4.9% GDP is a catch up to what can only be viewed as under-reporting of previous quarters. 

How that change affects going forward, is uncertain to me. Given the wide array of expectations for 4Q23, I am thinking not everyone is on the same page. I am done harping about this.

Now on to the PCE report, after reviewing adjustments...

Yes, inflation is slowing, not deflating, with the exception of gasoline, which looks to have stopped falling.

The monthly summary...

All in all, a pretty good monthly report card. I do think the market is making too big a deal on expectations of the FED cutting rates before summer, but what do I know?

Tuesday, December 5, 2023

A Further Review of 3rd Quarter, 2023 GDP... just for fun!!

So yes, the GDP was revised to 5.2% annualized, from 4.9% annualized. That does not mean the economy is robust. It's not bad, but robust is a bit of hype for politicians.

The BEA moved from 2012 dollars to 2017 dollars for the 3rd quarter releases and going forward, until next change in... say 5 years.

In theory, it should have been even across the board, after compensating for 5 years of dollar value adjustments, etc. Such as inflation being about 7.5% during that 5 year period.

If only there was someone, somewhere that downloads those excel spreadsheets from each GDP iteration.

Voila...


Note the column headings for 2012 dollars and 2017 dollars AND the % Change. The changes were clearly not uniform across the various groupings.

While there was a 9% upward adjustment, several groupings failed to match that rise, including some that went negative... while others outpaced the 9% reading.

So in theory, all the numbers going back in time were revised to reflect the current situation. But again, that was very uneven. Just consider the trade deficit, which is a drag on GDP... and those changes.

All in all, it did distort the 3rd quarter readings and possibly provided a misleading annualized number. That would be no big deal... if not for an election year and people willing to make everything political. 

While the current 5.2% annualized is being hailed as something significant, I wonder what will be hailed, when the 4th Qtr. 2023 is revealed on January 25th, 2024. My guess is way below that 5.2%. Back to the 2.0% annualized, or even lower!  

One can imagine the hysteria over such falling numbers, but the adjustment was improperly attributed to a "robust" economy.

So remember... the trade deficit, which is a drag on GDP was revised dramatically lower, after the BIG change for 2012 to 2017 dollars. That trade deficit adjustment was about 100% of that 5.2% annualized, or ±0.1% annualized without that lone adjustment.

You think I might be off my rocker! The current Real GDP rolls in at 22,506.4B, which is a hefty 281B above the 2nd qtr. figure of  22,225.4B. Now take a look at that downward revision of the trade deficit,  -284B. 

Remember the trade deficit is a drag on GDP, so a downward revision in the Trade deficit would result in a higher GDP print. IF the GDP had not been revised downward by -284B, then that +281B gain in GDP would evaporate. As in +0.1% annualized.


Oh well! It is just numbers and you can believe what you want. However... that adjustment was one time only, for the time being and 4Q23 will be significantly lower, imho. How does a drop off from +5.2% annualized to say +1.7% annualized look in an election year. 

One group will claim the economy is crashing into a recession, another group will be saying soft landing is working, and another group will be screaming the FED must cut rates rapidly.

I then ask you, if stating the 3Q23 was actually 0.1% and the 4Q24 was +1.7%, would indeed indicate a possible soft landing. Of course, the groups would likely being crying the same thing... just 3 months earlier.

It is fun to watch all the spin!

Thursday, November 30, 2023

Review of October 2023 data, GDP, PCE and personal income

Just some charts with a bit of commentary...


The headlines proclaimed a resilient consumer propelled the advance estimate of 4.9% annualized... to 5.2%. Seriously, the PCE slipped from 4.0% to 3.6%. You could toss in Residential investment, but you still come up lacking. 

It was a good report, but could have done without the spin, imho.


A couple of charts about PCE. Adjustments are in red. Again, a good report.

And to finish up the charts...

October ended up being an all around good month. May it continue.


Friday, September 29, 2023

Review of August data and the September PCE Release

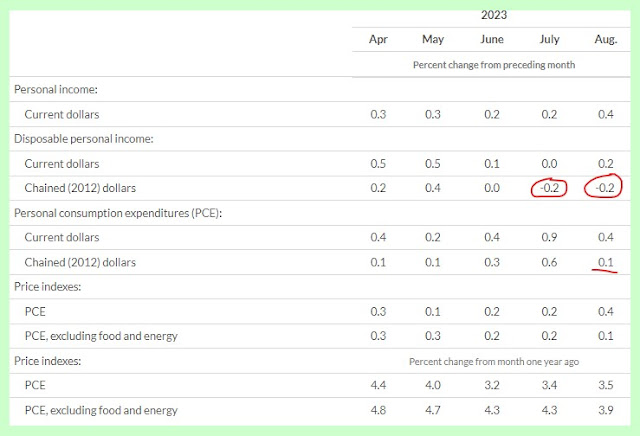
Yep, today's report was positive, with an uptick of +0.4%. That being in current dollars and when adjusted for inflation became... -0.2% for the month to month. The good news was the year to year inflation adjusted +0.1%. 

I did not denote the various changes from previous month's release, so but can be seen in previous publications.


It should be noted that multiple adjustments were made to previous readings, as indicated below...


The FED chain type report of PCE, excluding food and energy was adjusted to 2017 from previous 2012.


The 3.9% current, hearkens back to May of 2021, when things were transitory. The signs are pointing downward, but that 3.0% target remains distant, imho.

The scorecard for this month looks like this.

If I were grading this report, it would be 47.1%, compared to last month's 52.9%. Translation: My confidence in inflation heading towards 2.0% is not as great as some are predicting. 

Thursday, August 31, 2023

Review of July data and the August PCE Release

Some ups and some down in the latest release from the BEA. (red revised down, green revised up).

Chained dollar disposable income was revised down for April and June, with a negative print on July.

However, the chained dollar PCE was revised down for March and May, with upward revisions in April and June. 

It seems evident that savings AND debt are currently driving the economy. How long that can last is the big question.

Then there is the matter of PCE Excluding Food & Energy. If the target is 2%, then there is a way to go, given the forecast for August is at 4%. Years ago, when the PCE ex food and energy was failing to achieve even 2%, there was discussion of moving the target to 4%. 

That hasn't happened, so how can it be expected for the FED to ease off the interest rates? 

https://www.bea.gov/news/2023/personal-income-and-outlays-july-2023
We are now 28 months with the PCE ex food and energy above the 2% mark, and 17 months into the FED increasing rates. 10 months out, with the aforementioned halting its rise. 


The chart below indicates some problems still within the system. Last month had just one category in pink. 

We are at the end of August and its data will likely be similarly ugly. Let's hope for some relief in September. 


Week Ending Report-August 16th, 2025

A few reports of interest (to me), from this past week. CPI Real earnings Petroleum Producer Price Index Retail Sales The inflation report ...