Friday, September 29, 2023

Natural Gas Summary, UK, EU, USA... Week Ending 9-29-2023

The Energy Information Administration released their weekly report


At long last, all regions are above both last year and 5 year average. Hooray!
EIA.GOV via SNL Energy
Now for a look at The European Union and United Kingdom.

[The reason for this observation is LNG, which has introduced the prospect of U.S. Natural Gas prices being affected by global demand for LNG. The EU and UK serve as a benchmark for these demand issues.]

Time to wrap up the publishing of this weekly natural gas summary...


Review of August data and the September PCE Release

Yep, today's report was positive, with an uptick of +0.4%. That being in current dollars and when adjusted for inflation became... -0.2% for the month to month. The good news was the year to year inflation adjusted +0.1%. 

I did not denote the various changes from previous month's release, so but can be seen in previous publications.


It should be noted that multiple adjustments were made to previous readings, as indicated below...


The FED chain type report of PCE, excluding food and energy was adjusted to 2017 from previous 2012.


The 3.9% current, hearkens back to May of 2021, when things were transitory. The signs are pointing downward, but that 3.0% target remains distant, imho.

The scorecard for this month looks like this.

If I were grading this report, it would be 47.1%, compared to last month's 52.9%. Translation: My confidence in inflation heading towards 2.0% is not as great as some are predicting. 

Thursday, September 28, 2023

Quick Review of The GDP report 2Q-2023, 3rd estimate

First off, the base year for chained dollars is now 2017, instead of the previous 2012.

Secondly, there were revisions in past quarters, or updates. This is done annually. 

  • 2023 Quarter one GDP was revised upward, from 2.0% annualized, to 2.2% annualized.
  • 2023 Quarter one GDI was revised upward from -1.8% annualized to 0.5% annualized.

There are other changes, but that was a sampling.

While the chained dollar report for last month, based on 2012, showed the Real GDP at 20.387T, the new report based on 2017, is now 22.225T. 

However, there were significant reductions in the report, with Durable Goods being reduced, both on the personal consumption level and imports. 

Clearly there were large adjustments elsewhere to overcome those changes, such as in personal consumption services (quite large), Fixed Investment and Government consumption and Net exports of goods and services.

Nothing really out of line from expectations, although the Personal Consumption Expenditures for Goods was quite a drop from Quarter one. However, it is still positive and the drop was not quite a surprise, as the Monthly PCE report has been screaming a sharp decline.

Wednesday, September 27, 2023

This Week in Petroleum Summary 9-27-2023, per EIA.GOV

Gasoline prices (per AAA) fell from last report's $3.875, to $3.832. One year ago the price was $3.747, and was rising higher into Mid October's peak, then heading for the December low of $3.096.

Consumption edged down -2.5% from previous week and appears to be going into the fall season decline, with the year over year up just +0.7%. 


Data per the EIA weekly report

Crude stocks decreased -2.2M barrels, from last week, and is -4.5% below the 5 year seasonal average. It should be noted the 5 year average includes the abnormal 2020 and 2021 number. Otherwise, the current inventory is -1.6% below that adjusted 5 year average.

Distillates inventory rose +340K barrels; and Gasoline inventories eose +1027K barrels. Distillates (-10.2%,-1.5%) and Gasoline (-0.9%, -0.2%) are both below 5 year and 3 year adjusted average inventories.

The SPR decreased -250K barrels this past week. Breaking a 7th consecutive week streak for increases, which were the first since January, 2021.

WTI is $93.72, compared to $90.27 (+3.8%), one week ago, and $81.24 one year ago (+15.4%).

Refinery slipped on a weekly basis, but remains above year ago levels.

For anyone interested, the U.S. has exported 873M barrels of crude and petroleum products, more than imported, since March 1, 2022. That number increased by 12M barrels this past week. 

Gasoline exports/imports saw a net increase of 728K barrels this past week, with the tally since March 1, 2022, being 113.7M barrels being exported over imports.

Despite the surge in crude prices this week, domestic demand points towards pump prices drifting lower. However, that may be based on hope, rather than real time data.

This wraps up my publication of the weekly petroleum summary. I will continue to track, but not publish.

Monday, September 25, 2023

My electricity bills over time (January 2017~ September 2023)

Once again, I monitor my residential electricity costs.


As always, weather is a factor in consumption, which is why a rolling average is also important. Currently, that 12 month rolling average is +0.6% above last year. Which might indicate the cost running slightly below last year, when factoring in the following.
[I suspect it might be lower, as I altered the thermostat settings in December of 2022. I adjusted the nighttime heating settings from 68°F to 72°F, which would increase the usage in winter time. Daytime heat settings remained at 72°F.

Cooling settings remain at 76°F daytime and 72°F for nighttime. Additionally, the number of days between meter readings vary.]


Currently, the 2023 average is above last year, but that is with 3 more months of bills to follow, which are generally... sightly lower than current average. Also, it should be noted that year over year... or base effects come into play, which tends to hide the overall increases. 

So what might seem like good news, still carries quite a bite on the budget. The CPI-U suggests that the average consumer spends about 2.559% of their expenses on electricity... or about $150 per month. 

My average is significantly short of that dollar amount, percentage wise. However my electricity expenses, compared to overall expenses, is well north of 2.559%. Which means other items in the expenditure basket are constrained.

While it (electricity costs) might end up being below last year, the cost of that electricity  has surged 11.6% since February, 2021. I don't expect it to fall back to levels of that time.

Friday, September 22, 2023

Natural Gas Summary, UK, EU, USA... Week Ending 9-22-2023

The Energy Information Administration released their weekly report.


The Pacific Region has pushed above year ago levels and is very near the 5 year average.


Now for a look at The European Union and United Kingdom.

[The reason for this observation is LNG, which has introduced the prospect of U.S. Natural Gas prices being affected by global demand for LNG. The EU and UK serve as a benchmark for these demand issues.]

Data from the Aggregated Gas Storage Inventory report...


The United Kingdom continues to slide in percent of storage filled. It should be noted that UK does have access to natural gas supplies and infrastructure for LNG. However, the flip side is more abrupt changes in pricing.


Which is most noticeable in the forward futures, as shown on this chart.


The US market continues to be somewhat stable. 

Thursday, September 21, 2023

Comparison of Inflation in selected countries- September, 2023 Edition

With the United Kingdom, Canada and EUstats release of August data, I have updated my comparison graph. [Note, the USA(EU method) is directly from Eurostat.]


The USA (CPI: +3.7%; +2.5% Eurostate method) and Canada +4.0%, ticked up for the 2nd consecutive month, with regards to year over year inflation. 

The EU has marked 10 consecutive months of decline in year over year inflation at 5.9%. That figure was down from 6.1% last month. It was not even across the board, as Germany's 6.5% of last month, dipped to 6.4%, which was improvement, but some countries... such as France increased from 5.1% to 5.7%, according to Eurostat.

The UK has now marked its 3rd consecutive decline at 6.3%, with the month over month at +0.4%, which was up from previous 2 months.

Wednesday, September 20, 2023

This Week in Petroleum Summary 9-20-2023, per EIA.GOV

Gasoline prices (per AAA) rose from last report's $3.848, to $3.875. One year ago the price had fallen to $3.674, but was at a low, before heading higher into Mid October's peak, then heading for the December low of $3.096.

Consumption edged down -1.8% from previous week and may be going into the fall season decline, even though the year over year is still up +2.9%. 


Data per the EIA weekly report
Crude stocks decreased -2.1M barrels, from last week, and is -3.9% below the 5 year seasonal average. It should be noted the 5 year average includes the abnormal 2020 and 2021 number. Otherwise, the current inventory is -1.1% below that adjusted 5 year average.

Distillates inventory fell -2.9M barrels; and Gasoline inventories fell 831K barrels. Distillates (-11.5%,-3.1%) and Gasoline (-1.4%, -0.9%) are both below 5 year and 3 year adjusted average inventories.

The SPR increased another 600K barrels this past week. This is the 7th consecutive week for increases, which were the first since January, 2021.

WTI is $90.27, compared to $88.77 (+1.7%), one week ago, and $82.43 one year ago (+9.5%).

Refinery slipped on a weekly basis, but remains above year ago levels.

For anyone interested, the U.S. has exported 861M barrels of crude and petroleum products, more than imported, since March 1, 2022. That number increased by 16M barrels this past week. 

Gasoline exports/imports saw a net increase of 4.4M barrels this past week, with the tally since March 1, 2022, being 113M barrels being exported over imports.

Despite the draw on gasoline inventory, which was almost entirely a result of exports, the decrease in nationwide consumption indicates pump prices are at or near peak and some relief should follow.

Diesel prices are still leaning towards edging upward at this time. 

All of this is my opinion and yours may differ.

Friday, September 15, 2023

Natural Gas Summary, UK, EU, USA... Week Ending 9-15-2023

The Energy Information Administration released their weekly report.

The Pacific Region has pushed above year ago levels and is nearing the 5 year average.
EIA.GOV, via SNL Energy

Now for a look at The European Union and United Kingdom.

[The reason for this observation is LNG, which has introduced the prospect of U.S. Natural Gas prices being affected by global demand for LNG. The EU and UK serve as a benchmark for these demand issues.]

Data from the Aggregated Gas Storage Inventory report...

The overall EU pct. slipped since last week, but the volume in storage increased, as capacity increased.

While the EU as a whole, has approximately 100 days of supply, it should be noted that days supply varies greatly within the individual countries. 

Prices edged up in the EU and UK.

U.S. Henry Hub finished the week down -3¢.


Both TTF (Dutch) and UKG remain approximately double historical norms. Henry Hub is running about 2/3 of those norms. 


Thursday, September 14, 2023

9-14-23, Advance Retail Sales Report for August Data

Advance Monthly Sales for Retail and Food Services, August 2023

Advance estimates of U.S. retail and food services sales for August 2023, adjusted for seasonal variation and holiday and trading-day differences, but not for price changes, were $697.6 billion, up 0.6 percent (±0.5 percent) from the previous month, and up 2.5 percent (±0.7 percent) above August 2022. Total sales for the June 2023 through August 2023 period were up 2.2 percent (±0.4 percent) from the same period a year ago. The June 2023 to July 2023 percent change was revised from up 0.7 percent (±0.5 percent) to up 0.5 percent (±0.2 percent).

Retail trade sales were up 0.6 percent (±0.5 percent) from July 2023, and up 1.6 percent (±0.5 percent) above last year. Gasoline stations were down 10.3 percent (±1.1 percent) from last year, while food services and drinking places were up 8.5 percent (±2.3 percent) from August 2022.

Again... "not for price changes", means not adjusted for inflation.


Much is being made of "gasoline's" impact, but the numbers, when adjusted for inflation continue to remain rather stagnant, with adjusted spending remaining rather flat since the roll out of the vaccines and that $1,400 stimulus in spring 2021. Which also coincides with the ramp up of inflation.


Last month, my mood was elevated, as previous month's data had been revised upward, after so many months of downward revisions. 

We seem to be at it again. Can I expect this month's numbers to be revised downward... next month? Revising a previous month downward, then claiming +0.6% increase, while then stating it is mostly gasoline, is befuddling to me. 

Somehow, I expect the cycle to continue, without anyone questioning those banner numbers. 

Producer Price Index September release with August 2023 Data

The BLS has released the July Producer Price Index Report (historical releases) 

The Producer Price Index for final demand increased 0.7 percent in August, seasonally adjusted, after rising 0.4 percent in July, the U.S. Bureau of Labor Statistics reported today. (See table A.) The August advance is the largest increase in final demand prices since moving up 0.9 percent in June 2022. On an unadjusted basis, the index for final demand rose 1.6 percent for the 12 months ended in August.

In August, 80 percent of the rise in final demand prices is attributable to a 2.0-percent jump in the index for final demand goods. Prices for final demand services advanced 0.2 percent.

The index for final demand less foods, energy, and trade services increased 0.3 percent in August, the same as in July. For the 12 months ended in August, prices for final demand less foods, energy, and trade services rose 3.0 percent, the largest advance since moving up 3.4 percent for the 12 months ended in April.


So, the story is about gasoline prices creating most of the PPI. This might be true, but the current forecast is up and not down for that commodity.


Everything is screaming some future relief, except for what drove the August PPI higher. September is shaping up as a repeat of August, imho.


Not the most scientific metric, but there is more pink than last month. Not saying inflation is about to accelerate, but not so sure that crude oil will taper off its current rise. And we should remember that yesterday's CPI report mentioned the impact of gasoline, but also indicated that energy prices were down compared to one year ago... current at 294.328, year ago at 305.372. Gasoline current... 336.979, year ago at 348.593.

So, if last month's PPI was impacted by energy and thereby distorting the number, then energy being cheaper this year than last... would indicate the YoY 1.6% is also distorted. In fact the release indicates the PPI excluding energy was 2.0%. 

That is not a bad number, imho. Things are indeed looking up... except for pump prices, which are also looking up, but not in a good way.

Wednesday, September 13, 2023

This Week in Petroleum Summary 9-13-2023, per EIA.GOV

Gasoline prices (per AAA) rose from last report's $3.827, to $3.848. One year ago the price had fallen to $3.707, and was on its downward trajectory... into the early September lull, about $3.80. It rose a bit, then fell back to the December low of $3.096.

Consumption edged down a bit.


Data per the EIA weekly report

Crude stocks increased +4.0M barrels, from last week, and is -3.6% below the 5 year seasonal average. It should be noted the 5 year average includes the abnormal 2020 and 2021 number. Otherwise, the current inventory is -0.4% below that adjusted 5 year average.

Distillates inventory rose +3.9M barrels; and Gasoline inventories rose +5.6M barrels. Distillates (-10.7%,-2.0%) and Gasoline (-1.0%, -0.3%) are both below 5 year and 3 year adjusted average inventories.

The SPR increased another 290K barrels this past week. This is the 6th straight week for increases, which were the first since January, 2021.

WTI is $88.77, compared to $86.70 (+2.4%), one week ago, and $87.36, one year ago (+1.7%).
Refinery slipped on a weekly basis, but remains above year ago levels.

For anyone interested, the U.S. has exported 845M barrels of crude and petroleum products, more than imported, since March 1, 2022. That number actually decreased by 3M barrels this past week. Likely due to the massive drop in crude exports, which may be attributed to when a ship leaves port. Look out next week.

Taking that into consideration... crude stocks may wane, compared to this time last year, with current days supply at 25.2, to last year's 26.7 days.

Gasoline exports/imports were about even this past week, with the tally since March 1, 2022, being 108.4M barrels being exported over imports.

Inventories are up across the board, with refineries purring right along. Pump prices should be falling, but they aren't. All those signs are pointing to $4 a gallon.

What am I missing?

BLS Data Dump. Real Earnings - September 13, 2023

The BLS has released the latest Real Earnings Report

Real average hourly earnings for all employees decreased 0.5 percent from July to August, seasonally adjusted, the U.S. Bureau of Labor Statistics reported today. This result stems from an increase of 0.2 percent in average hourly earnings combined with an increase of 0.6 percent in the Consumer Price Index for All Urban Consumers (CPI-U).

Real average weekly earnings decreased 0.1 percent over the month due to the change in real average hourly earnings combined with a 0.3-percent increase in the average workweek.  

Real average hourly earnings increased 0.5 percent, seasonally adjusted, from August 2022 to August 2023. The change in real average hourly earnings combined with a decrease of 0.3 percent in the average workweek resulted in a 0.3-percent increase in real average weekly earnings over this period.

The report was a bit of setback in earnings, as the hourly rate fell -5¢. It is up +2¢ somce February 2020.

Weekly earnings decline -38¢ from last month, although up +95¢ from February 2020.

The above charts include all categories of workers.

Now for the production and non supervisory...

This category saw a drop of -6¢ per hour, although still +15¢ above February 2020.

Weekly is a bit different...

2 consecutive months of decline, although not a trend at this point. Down -89¢ on the month, although still +$6.02 above February, 2020.

I do remember last month being hailed as proof of something. I forget what it was, but this month is also proof of something. Can't wait to hear the spin on this... if it even crops up in the news cycle.

That gasoline index, cited in August as being below last August... is true. Per AAA, the average for August 2022 was $3.97 and this year at $3.84. BUT, September of 2022 averaged $3.73 and thus far this month is $3.82 and current trading indicate today's national average of $3.85... is heading north of $4 very soon. 

I guess reviewing today's crude report is next on the agenda.

BLS Data Dump. CPI - September 13, 2023

First up is the BLS Report for CPI...(historical releases)

The Consumer Price Index for All Urban Consumers (CPI-U) rose 0.6 percent in August on a seasonally adjusted basis, after increasing 0.2 percent in July, the U.S. Bureau of Labor Statistics reported today. Over the last 12 months, the all items index increased 3.7 percent before seasonal adjustment.

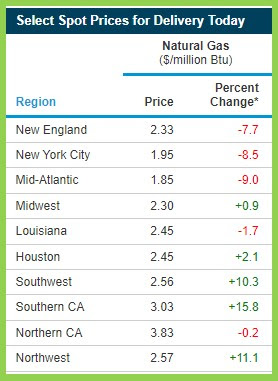
The index for gasoline was the largest contributor to the monthly all items increase, accounting for over half of the increase. Also contributing to the August monthly increase was continued advancement in the shelter index, which rose for the 40th consecutive month. The energy index rose 5.6 percent in August as all the major energy component indexes increased. The food index increased 0.2 percent in August, as it did in July. The index for food at home increased 0.2 percent over the month while the index for food away from home rose 0.3 percent in August. 

Depending on which consensus forecast you use, this was either slightly above or slighty below.

It was slightly below my chosen group. I had mentioned +0.8% increase, versus +0.6% actual. Both the month to month and annual were slightly below my chosen group's forecast. +3.8% versus +3.7%.

The actual readings.

Then there is my personal results, which is important to me. +0.4% M/M and +1.8% Annual.
Now for the C.O.L.A projections...


I can nearly predict the C.O.L.A will be +3.2%. This is based on the expecation the minimum September number would be 301.829 (+0.09%) and the maximum being 302.704 (+0.038%). Given current forecasts, the September numbers should be in this range. 

Considering that the C.O.L.A is nearly set at 3.2%, it is time to look at impact on old folks, such as myself. While mine edged up this month, the R-CPI-E, is well above the 3.2% C.O.L.A. at 4.2%. R-CPI-E stands for Research CPI Experimental, not the retired cpi elderly, that some people think. However, it was experimental research targeting 62 year olds and over. 

For years the Medicare B standard rates were announced in November. Last year the Biden Adminstration had it announced almost simultaneously with the C.O.L.A. While the Biden White House ballyhooed the 8.7% C.O.L.A. as an achievement, then quickly caught flak for taking credit for inflation, they were able to rejoice in the Medicare B standard rates falling. 

With the likelihood of Medicare B standard rates being raised... Gee, I wonder when that announcement will come?

With the headline CPI being 3.2% in July, and currently 3.7% for August, the September forecast of 3.6% will come out... just as that likely 3.2% C.O.L.A. is announced.

This is called a political dilemma.

Of course, no one is mentioning the real earnings report, which I will delve into next.


Friday, September 8, 2023

Natural Gas Summary... Week Ending 9-08-2023

The Energy Information Administration released their weekly report.


The Pacific Region continues to be slightly ahead of year ago numbers, but still below the 5 year average, although still improving.

The South Central Region continued the slide against year ago levels, but is still above 5 year average.

EIA.GOV, via SNL Energy
Now for a look at The European Union and United Kingdom.

[The reason for this observation is LNG, which has introduced the prospect of U.S. Natural Gas prices being affected by global demand for LNG. The EU and UK serve as a benchmark for these demand issues.]

Data from the Aggregated Gas Storage Inventory report...

Data per AGIS
The UK continues to reduce inventory, while Austria and Belgium slipped from last report.


Overall, NatGas prices slipped compared to last week.


Thursday, September 7, 2023

This Week in Petroleum Summary 9-07-2023, per EIA.GOV

Gasoline prices (per AAA) slipped from last report's $3.827, to $3.803. One year ago the price had fallen to $3.764, with today's price now +1.0% above year ago.


Consumption of gasoline continues to edge up +0.3% over last week, and 2.4% above one year ago level. 


Data per the EIA weekly report

Crude stocks slid another -6.3M barrels, from last week, and is -4.6% below the 5 year seasonal average. It should be noted the 5 year average includes the abnormal 2020 and 2021 number. Otherwise, the current inventory is -0.8% below that adjusted 5 year average.

Distillates inventory rose +679K barrels; and Gasoline inventories slipped about -2.7M barrels. Distillates (-12.3%,-3.0%) and Gasoline (-3.3%, -2.2%) are both below 5 year and 3 year adjusted average inventories.

The SPR increased another 800K barrels this past week. This is the 5th straight week for increases, which are the first since January, 2021.

WTI is $86.70, compared to $81.74 (+6.1%), one week ago, and $83.07, one year ago (+4.4%).
Refinery edged up on a weekly basis, and is slightly above above year ago levels

For anyone interested, the U.S. has exported 848M barrels of crude and petroleum products, more than imported, since March 1, 2022. It jumped +18M barrels this past week. (Distillates account for approximately 77%.

Overall, crude stocks are beginning to wane, compared to this time last year, with days supply at 25.0, to last year's 26.4 days.

Gasoline exports/imports were about even this past week, with the tally since March 1, 2022, being 108.4M barrels being exported over imports.

Next Wednesday will be the August CPI release. With the motor fuel index jumping nearly 7% in August, expect the report to say something like half of the increase being energy. Having said that... +0.8% could be a month to month increase for the overall. 

In any case, stock up on dramamine to offset the enormous spin about to take place. /s

Review of March 2024 data, 1Q GDP, PCE and personal income

The monthly summary is not so wonderful, incomparison... Inside all that pink is some troubling food related issues. Even though energy is s...