Showing posts with label United Kingdom. Show all posts

Sunday, October 20, 2024

Comparison of Inflation in selected countries- October, 2024 Edition

With the United Kingdom, Canada, and EUstats release of June data, I have updated my comparison graph. [Note, the USA(EU method) is directly from Eurostat]


Looking at the same period of time, for USA, EU(27), UK, USA(using EU methodology), results in the following..


I suspect the USA number, might edge up in the upcoming month, but while I will continue to track, this should wrap up the blogging portion... or not.

Friday, September 20, 2024

Comparison of Inflation in selected countries- September, 2024 Edition

With the United Kingdom, Canada, and EUstats release of June data, I have updated my comparison graph. [Note, the USA(EU method) is directly from Eurostat]


Looking at the same period of time, for USA, EU(27), UK, USA(using EU methodology), results in the following...


Despite the current similarities, the timeframe has a considerable difference.


I point this out, as while there were some similar causes, there were causes of significant difference, and the timing was different as well.

In any case, the inflation story has about run its course, or so we can hope!


Sunday, August 25, 2024

Comparison of Inflation in selected countries- August, 2024 Edition

With the United Kingdom, Canada, and EUstats release of June data, I have updated my comparison graph. [Note, the USA(EU method) is directly from Eurostat]


Looking at the same period of time, for USA, EU(27), UK, USA(using EU methodology), results in the following...


Despite the current similarities, the timeframe has a considerable difference.


I point this out, as while there were some similar causes, there were causes of significant difference, and the timing was different as well.

In any case, the inflation story has about run its course, or so we can hope!


Thursday, July 18, 2024

Comparison of Inflation in selected countries- July, 2024 Edition

With the United Kingdom, Canada, and EUstats release of June data, I have updated my comparison graph. [Note, the USA(EU method) is directly from Eurostat]


Looking at the same period of time, for USA, EU(27), UK, USA(using EU methodology), results in the following...


Despite the current similarities, the timeframe has a considerable difference.


There are multiple factors involved in sorting out the variances in when inflation started.
  • Clogged ocean shipping containers in wrong places.
  • Massive stimulus
  • Vaccine rollout
  • Ukraine Invasion
  • Perception of definite strikes at ports for July, 2022
  • Timing of rate hikes
As for political considerations, the stimulus rollout could be considered political and there is whether the Ukraine invasion would have taken place. All other items would likely have occurred, imho.

In any case, the inflation situation has largely abated, so it is time to give this type of review... a rest.

Tuesday, June 25, 2024

Comparison of Inflation in selected countries- June, 2024 Edition

With the United Kingdom, Canada, and EUstats release of May data, I have updated my comparison graph. [Note, the USA(EU method) is directly from Eurostat]


Looking at the same period of time, for USA, EU(27), UK, USA(using EU methodology), results in the following...


Despite the similarities, the timeframe has a considerable difference.


We must remember that inflation in the USA was transitory, until the rest caught up. 


Thursday, May 30, 2024

Comparison of Inflation in selected countries- May, 2024 Edition

With the United Kingdom, Canada and EUstats release of April data, I have updated my comparison graph. [Note, the USA(EU method) is directly from Eurostat with the exception of April-2024. That data was calculated by me]


Inflation across these countries are now very similar, after some issues early on.

A reminder, that U.S. inflation rose upward in advance of those other countries.


While it has been popular, of late to say inflation was everywhere... it wasn't until it was. The period between was called "transistory".

There were factors unique to the U.S., as well as those other countries in the EU, as well as the U.K.

Unique to the E.U. and U.K. were natural gas issues over Ukraine/Russia

Unique to the U.S. were...
  • Rapid roll out of vaccines
  • Proclamations of Covid being whipped.
  • Massive stimulus mailed directly to households, plus government programs
  • Refinery outages  in Texas.
  • Am eminent dock workers strike, that didn't take place.
Common to both...
  • Low petroleum and petroleum product inventories
  • Container congestion, due to empty containers in all the wrong places.
  • European decision to curtail NG and petroleum imports from Russia.
So the finger pointing becomes clear, when comparing the conditions that were in place, the actions taken + direct results, etc.

Thursday, April 18, 2024

Comparison of Inflation in selected countries- April, 2024 Edition

With the United Kingdom, Canada and EUstats release of March data, I have updated my comparison graph. [Note, the USA(EU method) is directly from Eurostat.]


As always, here is a snapshot of early inflation or transitory, until it turned in to everybody's problem.


To rehash, the U.S. transitory inflation was a product of massive stimulus and a snarled global supply chain. Retailers in a desperate bid to restock, inflated shipping container prices, shipping costs, etc. Which did lead to pressures globally. 

Then came the energy crunch, which really impacted globally... for awhile.


Inflation seems to be steadying across the board. The expectations for a continuing slowing... is up in the air. 

Wednesday, March 20, 2024

Comparison of Inflation in selected countries- March, 2024 Edition

With the United Kingdom, Canada and EUstats release of February data, I have updated my comparison graph. [Note, the USA(EU method) is directly from Eurostat.]


The rates are aligning in a narrow band across this spectrum.

However, it was NOT always the same, and the reasons for that are different, despite the gullible people fawning over, and blindly following their particular political puppeteer.

This is from the "beginning".

I will not bore you with the whys, but a quick look at some important issues...

Another month in the bag, with inflation seemingly slowing on an annual rate, but generally speaking, the month over month rate, when annualized... is well above the annual rate. More work to do?

Saturday, February 24, 2024

Comparison of Inflation in selected countries- February, 2024 Edition

With the United Kingdom, Canada and EUstats release of December data, I have updated my comparison graph. [Note, the USA(EU method) is directly from Eurostat.]

The rates are indeed about the same across this spectrum.

However, it was NOT always the same, and the reasons for that are different, despite the gullible people fawning over, and blindly following their particular political puppeteer.


Done for this month.


Friday, January 19, 2024

Comparison of Inflation in selected countries- January, 2024 Edition

With the United Kingdom, Canada and EUstats release of December data, I have updated my comparison graph. [Note, the USA(EU method) is directly from Eurostat.]


A slight upward tick on the annual figures... across the board. I would expect some easing, once the January data comes forward.

For the silly ninnies that forget history, attempt to revise history, or are so gullible to be misled by their dear leaders...

Long before inflation was everywhere, the phrase was transitory. Yes Virginia, the USA led that "transitory" inflation, until the rest of the world started catching up. 

The chart is quite "busy", but the timeline is quite accurate. 

'nuff said!

Wednesday, December 20, 2023

Comparison of Inflation in selected countries- December, 2023 Edition

With the United Kingdom, Canada and EUstats release of November data, I have updated my comparison graph. [Note, the USA(EU method) is directly from Eurostat.]


For those individuals unable to think on their own and unable to question their masters, here is a timeline in rebuttal to the everyone has inflation. Look at the above chart to consider the timeline and now look at the below chart...


The EU method of calculating inflation is used, to better gain an apples to apples comparison. Yes, that line on top is U.S. inflation running well ahead of the EU and UK, or (sadly) what the your masters consider the rest of the world in U.S. political speak.

Geez!!!


Wednesday, November 22, 2023

Comparison of Inflation in selected countries- November, 2023 Edition

With the United Kingdom, Canada and EUstats release of October data, I have updated my comparison graph. [Note, the USA(EU method) is directly from Eurostat.]


Friday, September 29, 2023

Natural Gas Summary, UK, EU, USA... Week Ending 9-29-2023

The Energy Information Administration released their weekly report


At long last, all regions are above both last year and 5 year average. Hooray!
EIA.GOV via SNL Energy
Now for a look at The European Union and United Kingdom.

[The reason for this observation is LNG, which has introduced the prospect of U.S. Natural Gas prices being affected by global demand for LNG. The EU and UK serve as a benchmark for these demand issues.]

Time to wrap up the publishing of this weekly natural gas summary...


Friday, September 22, 2023

Natural Gas Summary, UK, EU, USA... Week Ending 9-22-2023

The Energy Information Administration released their weekly report.


The Pacific Region has pushed above year ago levels and is very near the 5 year average.


Now for a look at The European Union and United Kingdom.

[The reason for this observation is LNG, which has introduced the prospect of U.S. Natural Gas prices being affected by global demand for LNG. The EU and UK serve as a benchmark for these demand issues.]

Data from the Aggregated Gas Storage Inventory report...


The United Kingdom continues to slide in percent of storage filled. It should be noted that UK does have access to natural gas supplies and infrastructure for LNG. However, the flip side is more abrupt changes in pricing.


Which is most noticeable in the forward futures, as shown on this chart.


The US market continues to be somewhat stable. 

Thursday, September 21, 2023

Comparison of Inflation in selected countries- September, 2023 Edition

With the United Kingdom, Canada and EUstats release of August data, I have updated my comparison graph. [Note, the USA(EU method) is directly from Eurostat.]


The USA (CPI: +3.7%; +2.5% Eurostate method) and Canada +4.0%, ticked up for the 2nd consecutive month, with regards to year over year inflation. 

The EU has marked 10 consecutive months of decline in year over year inflation at 5.9%. That figure was down from 6.1% last month. It was not even across the board, as Germany's 6.5% of last month, dipped to 6.4%, which was improvement, but some countries... such as France increased from 5.1% to 5.7%, according to Eurostat.

The UK has now marked its 3rd consecutive decline at 6.3%, with the month over month at +0.4%, which was up from previous 2 months.

Friday, September 15, 2023

Natural Gas Summary, UK, EU, USA... Week Ending 9-15-2023

The Energy Information Administration released their weekly report.

The Pacific Region has pushed above year ago levels and is nearing the 5 year average.
EIA.GOV, via SNL Energy

Now for a look at The European Union and United Kingdom.

[The reason for this observation is LNG, which has introduced the prospect of U.S. Natural Gas prices being affected by global demand for LNG. The EU and UK serve as a benchmark for these demand issues.]

Data from the Aggregated Gas Storage Inventory report...

The overall EU pct. slipped since last week, but the volume in storage increased, as capacity increased.

While the EU as a whole, has approximately 100 days of supply, it should be noted that days supply varies greatly within the individual countries. 

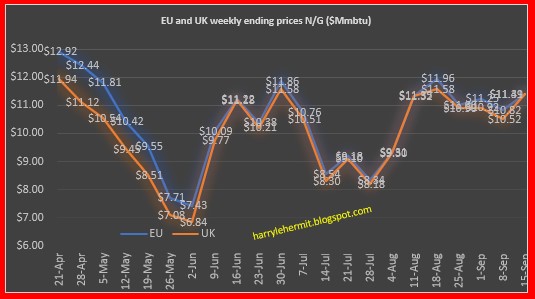
Prices edged up in the EU and UK.

U.S. Henry Hub finished the week down -3¢.


Both TTF (Dutch) and UKG remain approximately double historical norms. Henry Hub is running about 2/3 of those norms. 


Friday, September 8, 2023

Natural Gas Summary... Week Ending 9-08-2023

The Energy Information Administration released their weekly report.


The Pacific Region continues to be slightly ahead of year ago numbers, but still below the 5 year average, although still improving.

The South Central Region continued the slide against year ago levels, but is still above 5 year average.

EIA.GOV, via SNL Energy
Now for a look at The European Union and United Kingdom.

[The reason for this observation is LNG, which has introduced the prospect of U.S. Natural Gas prices being affected by global demand for LNG. The EU and UK serve as a benchmark for these demand issues.]

Data from the Aggregated Gas Storage Inventory report...

Data per AGIS
The UK continues to reduce inventory, while Austria and Belgium slipped from last report.


Overall, NatGas prices slipped compared to last week.


Friday, September 1, 2023

EU & UK NatGas Inventory Report, September 01, 2023

Data from the Aggregated Gas Storage Inventory report...

While up in most areas of Europe, Austria -.01%, Czech Republic -.02%, and the UK down -1.63%.

Pricing finds the U.S. back to normal, with the EU and the UK still elevated, as will likely continue for quite a period of time.


PPI November 2024 release with October 2024 Data

The BLS has released the November 2024  Producer Price Index Report  for the month of October .  ( historical releases ) The Producer Price ...