Showing posts with label C.O.L.A.. Show all posts

Wednesday, April 10, 2024

BLS Data Dump. CPI - April 10th, 2024

First up is the BLS Report for CPI...(historical releases)

The Consumer Price Index for All Urban Consumers (CPI-U) increased 0.4 percent in March on a seasonally adjusted basis, the same increase as in February, the U.S. Bureau of Labor Statistics reported today. Over the last 12 months, the all items index increased 3.5 percent before seasonal adjustment.

The index for shelter rose in March, as did the index for gasoline. Combined, these two indexes contributed over half of the monthly increase in the index for all items. The energy index rose 1.1 percent over the month. The food index rose 0.1 percent in March. The food at home index was unchanged, while the food away from home index rose 0.3 percent over the month.

Here is the unadjusted CPI for the past 12 months...

My own personal CPI rose 3.0% Y/Y and 0.6% on the month...

Taking a look at the report card...


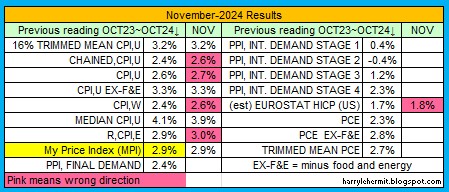
Not real pretty, imho. It should be noted the release partially laid the surge in inflation at the feet of energy. True on a monthly basis, but Y/Y is up 2.1%, compared to the headline of 3.5%. Even food was at 2.2%, so start looking much harder within that CPI ex food and energy number of 3.8%.

Speaking of food...


Hidden in all those numbers and weightings... food away from home ease barely above January, 2021 numbers. That is NOT adjusted for inflation, but in current dollars. I can't help but think the entities making up the food away from home category... is struggling.  

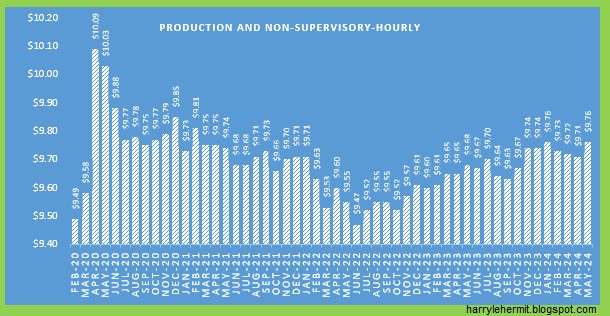
As for Real Earnings.

An increase of 4¢ from February, 2020. It is important to adhere to that timing, as it was before the disruption of the workforce, cue to covid.


The overall report does show some stagnation for wage growth. Hard to make anything uplifting from the data. 

Sorry!


Tuesday, March 12, 2024

BLS Data Dump. CPI - March 12th, 2024

First up is the BLS Report for CPI...(historical releases

The Consumer Price Index for All Urban Consumers (CPI-U) increased 0.4 percent in February on a seasonally adjusted basis, after rising 0.3 percent in January, the U.S. Bureau of Labor Statistics reported today. Over the last 12 months, the all items index increased 3.2 percent before seasonal adjustment.

The index for shelter rose in February, as did the index for gasoline. Combined, these two indexes contributed over sixty percent of the monthly increase in the index for all items. The energy index rose 2.3 percent over the month, as all of its component indexes increased. The food index was unchanged in February, as was the food at home index. The food away from home index rose 0.1 percent over the month.

While the chart below shows the past 12 months, it should be noted the end of 2022 also saw a downward trend, prior to 2023 rises. The February number continues the 2023 1st quarter upward swing.

On the other hand, my own personal CPI rate has continued upward, albeit not as high as the CPI-U.

That is 2.5% annual, with another sharp 0.4% increase for February. The reason last month was the medical category, but is more evenly spread for this month. My worse fear being that my personal rate is edging up towards the CPI-U rate, which seems mired in a narrow range.

The R-CPI-E did ease from last month's annual of 3.5% to this month's annual of 3.4%. The month to month was still at +0.6%, but is more of a rounding issue. Last month was +0.635% and this month at +0.554%.

Across the board resulted in this picture...

As for Real Earnings.

Not such a good report, as indicated by this graph...

While the downward spike of 3¢ per hour might not seem large, it follows downward revisions in two previous months. Revisions are a normal part of the process, but a troubling trend is frequency of downward revisions in previous month's data. This tends to enhance the belief of manipulation in an election year.

This follows the pattern of jobs, GDP, etc. Not a real confidence builder, imo.


Tuesday, February 13, 2024

BLS Data Dump. CPI - February 13, 2024

First up is the BLS Report for CPI...(historical releases)

The Consumer Price Index for All Urban Consumers (CPI-U) increased 0.3 percent in January on a seasonally adjusted basis, after rising 0.2 percent in December, the U.S. Bureau of Labor Statistics reported today. Over the last 12 months, the all items index increased 3.1 percent before seasonal adjustment.

The index for shelter continued to rise in January, increasing 0.6 percent and contributing over two thirds of the monthly all items increase. The food index increased 0.4 percent in January, as the food at home index increased 0.4 percent and the food away from home index rose 0.5 percent over the month. In contrast, the energy index fell 0.9 percent over the month due in large part to the decline in the gasoline index.

While the chart below shows the past 12 months, it should be noted the end of 2022 also saw a downward trend, prior to 2023 rises. The January number reverses the 2023 fall downward trend and achieves an all time high.


On the other hand, my own personal CPI rate has continued upward, with a decent jump last month.


That is 2.3% annual, with a sharp 0.6% increase for January. The reason mainly being under the medical category and the fact it takes up much more weight, than the BLS weighting does. Hopefully that trend doesn't continue, but after all the "medical" adjustment to the CPI now finished... look out! 

As a side note the R-CPI-E was up 0.6% for the month and 3.5% annual. (R-CPI-E= Research consumer price index for Americans age 62 years of age and older).

Also, the gasoline index is now popping, after actually falling in January. Again... look out!!

As for Real Earnings.


Weekly wages seem to be slowing for some reason, which is reflected across the board, to the working stiffs.


Not a really bad report, but be on the outlook for any worrying trends to develop, imho.

Still, the overall seems to be easing off, even if a hiccup here and there. 

Thursday, January 11, 2024

BLS Data Dump. CPI - January 11, 2024

First up is the BLS Report for CPI...(historical releases)

Not sure what the hoopla is about, regarding coming in hotter than expected. Factoring the rounding, it was just a few basis points above my expectations.

The index for shelter continued to rise in December, contributing over half of the monthly all items increase. The energy index rose 0.4 percent over the month as increases in the electricity index and the gasoline index more than offset a decrease in the natural gas index. The food index increased 0.2 percent in December, as it did in November. The index for food at home increased 0.1 percent over the month and the index for food away from home rose 0.3 percent. 

I highlighted a portion of that statements, as it is weird as heck. Gasoline in the November report was 297.598 and December gave a 280.289. Granted that is "unadjusted", but seriously... where did the increase in gasoline index come from? Nationally, the prices are down from last month, about 18¢ and down about 9¢ from December of 2022. Yet, somehow the "seasonally adjusted" edged up enough to offset something else.

Even by the BLS numbers from December, 2022... gasoline fell -1.5% (unadjusted)  on the month and was -9.4% on the seasonal adjustments. December, 2023... saw gasoline fall -1.9% on the unadjusted monthly, ... but rose +0.2 of the seasonal adjustments.  

In any case, the top number has decreased for 3 consecutive months. Now that would be seasonal, as November and December of 2022... saw decreases. It reversed in the January 2023 report.

My own personal CPI looks like this...
That is a +2.2% increase annually, and +0.1% for the month.

As for Real Earnings.


Remember when covid disrupted everything and massive shutdowns, layoffs, etc. Comparing that $380.95 real weekly earning, compared to February, 2020's $378.92. 

It is better than nothing!

Tuesday, December 12, 2023

BLS Data Dump. CPI - December 12, 2023

First up is the BLS Report for CPI...(historical releases)

The Consumer Price Index for All Urban Consumers (CPI-U) increased 0.1 percent in November on a seasonally adjusted basis, after being unchanged in October, the U.S. Bureau of Labor Statistics reported today. Over the last 12 months, the all items index increased 3.1 percent before seasonal adjustment.

I think the numbers were somewhat in line with everyone's expectations.

I do find the food portion of the darn thing a bit intriguing.


While the overall index has increased 17.4% since January, 2021, the food at home index has jumped 20.3%

Oddly, when adjusting the index to "average" household spending the food at home has jumped 29.6%, in current dollars.

What really catches the eye, is the -8.5% drop in current dollars for food away from home. This would be cafeterias, restaurants, and other places "away" from home.

This type of comparison with weightings against the index, further indicates a drop in current dollar spending for food in all categories... compared to rate of inflation.


The CPI index has an increase in prices of 20%, yet current dollar spending is 11.6%. The food away from home industry is not keeping up, as I suspect more meals are prepared at home... or people are cutting back on eating. [NOT]


Real average hourly earnings for all employees increased 0.2 percent from October to November, seasonally adjusted, the U.S. Bureau of Labor Statistics reported today. This result stems from an increase of 0.4 percent in average hourly earnings combined with an increase of 0.1 percent in the Consumer Price Index for All Urban Consumers (CPI-U).

Here is a graph...


Tis a nickel better than February, 2020. Merry Christmas!


Thursday, October 12, 2023

BLS Data Dump. CPI - October 12, 2023

First up is the BLS Report for CPI...(historical releases)

The Consumer Price Index for All Urban Consumers (CPI-U) rose 0.4 percent in September on a seasonally adjusted basis, after increasing 0.6 percent in August, the U.S. Bureau of Labor Statistics reported today. Over the last 12 months, the all items index increased 3.7 percent before seasonal adjustment.

The index for shelter was the largest contributor to the monthly all items increase, accounting for over half of the increase. An increase in the gasoline index was also a major contributor to the all items monthly rise. While the major energy component indexes were mixed in September, the energy index rose 1.5 percent over the month. The food index increased 0.2 percent in September, as it did in the previous two months. The index for food at home increased 0.1 percent over the month while the index for food away from home rose 0.4 percent. 

The index for all items less food and energy rose 0.3 percent in September, the same increase as in August. Indexes which increased in September include rent, owners' equivalent rent, lodging away from home, motor vehicle insurance, recreation, personal care, and new vehicles. The indexes for used cars and trucks and for apparel were among those that decreased over the month.

I had readings of 3.6%~3.9%, so the 3.7% was within that range.

The past 12 months...

My own CPI...
The C.O.L.A. was announced at 3.2%.

The results, compared to average S.S. income and various CPI methods. Once the average monthly S.S. is adjusted for Medicare Part B, the result is 2.9%.

Then compare the average 3 month of each CPI method, yields the headline CPI of 3.5%; Chained CPI at 3.6%; R-CPI-E at 4.1%; the end result of S.S. monthly minus projected Medicare part B... stands in sharp contrast to actual inflationary pressures.


'Nuff said!

This concludes my monthly publication of CPI.


Thursday, October 13, 2022

Breakdown of the CPI DATA and Real Earnings reports for September 2022

It is that time of month, to survey the damage from inflation. The BLS report was released this morning and it was a surprise. (historical releases)

This is what I projected for the month...

For next month's projection, another wide range... 7-8%~8.3%, with month to month of -0.1~ up to 0.3%. The drop in gasoline failed to cover all the other areas, and the drop in gasoline for September will be much smaller, in my opinion.

Hmm... 

The Consumer Price Index for All Urban Consumers (CPI-U) rose 0.4 percent in September on a seasonally adjusted basis after rising 0.1 percent in August, the U.S. Bureau of Labor Statistics reported today. Over the last 12 months, the all items index increased 8.2 percent before seasonal adjustment.
Click to Enlarge
My own personal CPI was 8.1% year over year and up 0.3% from last month.

Click to Enlarge
The C.O.L.A. for 2023 is set at 8.7%...

Click to Enlarge
Last month I had stated the likelihood of 8.7%, but then got antsy an edged up the forecast to 8.8%. I really did not anticipate the CPI-W would underperform, compared to the CPI-U. That string since the start of covid has apparently ended. In any case, it almost was 8.8%, as pushing out a couple of digits was 8.746%. That 291.854 was just off the 291.879 to edge it to 8.750% and rounding to 8.8%. 

That was me trying to justify my errors. Close only counts in horseshoes and hand grenades. 

As for the Real Earnings ...
Click to Enlarge
 
Click to Enlarge
It still has not gotten back to pre-covid purchasing power and slipped last month. Of course that is for hourly workers, while the earnings for production and non supervisory employees was actually up $.03 hourly, from pre-covid and $3.68 weekly. So, the working stiffs are healing faster.

Click to Enlarge

Click to Enlarge
Real earnings are already adjusted for inflation.

And an apples to apples comparison can also be made as unemployment now matches February 2020.
Click to Enlarge
We should remember Covid hit the lower wage earners the hardest, as they were originally deemed non-essential and sent home, thus distorting the hourly and weekly rate. The higher wage earners were able to "work from home" while masturbating on zoom calls, etc. Until they realized that some of those non essentials were actually a bit more essential than first thought.

In any case, a fair apples to apples is now compared to February 2020. At least that is my opinion.

Seemed like I was going to mention petroleum. Crude Oil inventory up nearly 10M barrels, with Gasoline up 2M barrels, and uh oh... distillates down 4.8M barrels. Natural Gas inventories are starting to gain ground as well.

Tomorrow is the retail report, which should be interesting.

Oh yeah... next month CPI at 8.1%~8.2%, with m/m of +0.8%.

Friday, September 30, 2022

Finishing Up Data for September, 2022

The BEA released the Personal Income and Outlays, August 2022 and Annual Update this morning.

Click to Enlarge
Note the PCE and PCE EX-F&E were revised according to BEA listing, but not revised in the above chart.

Click to Enlarge
Chained dollars continue with upward growth.

The BEA, also released the GDP yesterday and the headlines were unchanged. However, you had to read down quite a bit to the juicy part.

Real gross domestic income (GDI) increased 0.1 percent in the second quarter, a downward revision of 1.3 percentage points from the previous estimate. The average of real GDP and real GDI, a supplemental measure of U.S. economic activity that equally weights GDP and GDI, decreased 0.3 percent in the second quarter, a downward revision of 0.7 percentage point (table 1).

The GDI (Gross Domestic Income) was +1.8% for the 1st quarter, until this revision down to +0.8% and the 2nd quarter was revised downward from +1.4% to +0.1%. Still positive, but... not by much. 
When averaged with the GDP: 1st quarter from +0.1% to -0.4%; 2nd quarter from +0.4% to -0.3%.

The 3rd quarter advance estimate will be announced on October 27th. Bet on it being positive, until after the election and the 2nd estimate comes out on the 30th of November. Okay, it will likely still be positive, so I guess the "recession" was over in June. My opinion would be, we are not yet in a recession. 

I do wonder why the theory of 2 consecutive negative quarters has such a special meaning in the hearts of so many. I mean I get it, but claiming some historical significance, when faced with something of a 21st century phenomena, doesn't make sense. Especially when so many avoid talking about it, lest they be labeled as being part of some fringe group.

Click to Enlarge
Shame on me for even pointing it out. We did this to ourselves. It is oft stated that recognizing the problem is halfway to solving it. We are nowhere near recognizing it, in my opinion. 

Now for some good news. The Centers for Medicare and Medicaid Services announced...
The standard monthly premium for Medicare Part B enrollees will be $164.90 for 2023, a decrease of $5.20 from $170.10 in 2022. The annual deductible for all Medicare Part B beneficiaries is $226 in 2023, a decrease of $7 from the annual deductible of $233 in 2022.

It is unusual the announcement could be made so early, as it usually comes in mid November, which always fall just after an election. The announcement is barely visible on all those old people boards I follow. It's still good to be able to keep and additional $62.40 per year, even if it would purchase what was $57.35 last year.

Speaking of inflation, the September numbers from the BLS will come out on the 13th of October. Here is my current projection of C.O.L.A.

Click to Enlarge

I'm struggling on whether it will be 8.7% or 8.8%. Earlier, I had 8.6% in the mix, but I think that has gone bye bye. Likely 8.8%, with a possible 8.9%. 

Frankly, the likelihood of the CPI-U jumping 0.28% and the CPI-W at 0.37% is not unreasonable, although something a bit lower on the CPI-W lands at 8.8%.

In July, the -7.7% drop in gasoline covered up all the other price inflation taking place. In August, the -10% drop in gasoline could NOT cover up all the other price inflation taking place. September is ending with only a -5.5% drop in gasoline. So look out. 

Much of the reason for the national average of gasoline prices rising the past ten days, has to do with California switching from summer blend to winter blend. It happens every year. It should begin slowing next week. 

Most Americans don't grasp that, but politicians do. So a wonderful time to point out the national average is rising, proclaim retailers must halt the exploitation and then take a victory lap next week. We Americans are such suckers.

As for gasoline prices, I am not sure what they will do, when that 1MBPD SPR release ends just before the election. Couple that with the possibility of OPEC cutting a few barrels... who knows. 

Natural Gas is staying ahead of the curve and possibly gaining some...

click to enlarge

All in all, another decent month. It could be the last for awhile, but who knows? Or rather... who cares?


Oh yes... Natural Gas prices.

Click to Enlarge
Back early in the summer, the anticipated range for U.K. energy at the average household level, was £3,600 ~ £5,400 annual, based on what the market was indicating. Currently the range is £3,000 ~£4,100. If the £2,500 cap was based on the summer forecast, then maybe the new cap should be lower. 

Oh well, smarter people than I, are working on all this. That doesn't mean they don't make mistakes. As I make a lot of mistakes and don't pretend to be smart... no one really pays attention. But when a "pretentious" person errs... it is lights out. 


Tuesday, September 13, 2022

Breakdown of CPI DATA and Real Earnings, August 2022

It is that time of month, to survey the damage from inflation. The BLS report was released this morning and it was a surprise. (historical releases)

This is what I projected for the month...

Now for next month's CPI-U, and here's hoping I am once again overshooting... month over month at 0.0%~0.2% and year to year of 8.3% to 8.5%. 

Well, it was... 

The Consumer Price Index for All Urban Consumers (CPI-U) rose 0.1 percent in August on a seasonally adjusted basis after being unchanged in July, the U.S. Bureau of Labor Statistics reported today. Over the last 12 months, the all items index increased 8.3 percent before seasonal adjustment. 

Gasoline fell much, much further than last month and failed to provide cover for all the other areas, which are inflating. 

Click to Enlarge
Unadjusted remains sort of flat. Meanwhile my personal inflation rate edged up to 7.9%, with a +0.26% month to month increase. 

Click to Enlarge
On to the C.O.L.A. ... The CPI-W slid -0.2% for the month, which essentially narrowed the range for C.O.L.A. adjustments.
Click to Enlarge
Frankly speaking and after checking my pencil for an eraser... I'll pencil in 8.7% as the most likely C.O.L.A. The September CPI-W has a very wide range, as can be seen. Either side of the 8.7% figure is also a rather wide range.

As for the Real Earnings...
Click to Enlarge
The hourly is edging up slightly, but still below February 2020 rate.
Click to Enlarge
The weekly level slipped this month (all inflation adjusted) and is still below the February 2020 level.

For next month's projection, another wide range... 7-8%~8.3%, with month to month of -0.1~ up to 0.3%. The drop in gasoline failed to cover all the other areas, and the drop in gasoline for September will be much smaller, in my opinion. 

I guess what I am saying is... there could easily be another upside surprise, when the September numbers come out. I sincerely hope not. It has nothing to do with stocks, Federal Reserve or Macro Economics. I am just a poor schmuck getting squeezed.

Saturday, September 3, 2022

Another Look at C.O.L.A.


Click to Enlarge

Back in August I stated... somewhere between 8.6% ~ 9.0%. Clearly, a revision has taken place. Largely due to the continued drop in gasoline. 

If you remember the July CPI report, it stated the -7.7% gasoline number held off all the price increases in everything else. August is over and I am betting the August CPI will be -10% for gasoline. 

Of course, the C.O.L.A. is based on CPI-W, which slipped -0.1% in July and was 9.1% over the year.  -10% in gasoline would in theory... create an even lower number than -0.1%. Granted, the other stuff may be accelerating inflation wise, but I am not so sure about that. 

In any case, I suspect the CPI-W will be in the range as noted and the monthly change will be -0.3%~0.5%.

That would be stellar, except it is only gasoline and many other things like food, electricity, and heating bills are rising... going into that time of year. A lump of coal might be a welcome gift, come Christmas. (Hey, everything else has gone topsy turvy... why not?)

For the record, the C.O.L.A. announced in fall 1981 for 1982 year was 11.4%. The fall of 1982 announcement for year 1983 was 7.4%. This year's announcement should be between those two numbers.

And for the first time in a long while, there should not be much of an increase in Medicare B premiums. Mostly because we were over charged last year, but still, taking them at their word of that drug being half of last year's rise, and then they found out that drug was half the original price... we end up back to where we currently are for next year. That $60 we got over charged this year will be metered back to us this coming year. 

Saturday, August 13, 2022

Is It Still Too Early to Predict C.O.L.A.? And Some Other Observations...

I've had to revise downward, my previous forecast... by quite a bit. I am okay with that, as longing for inflation to continue upward, with the hopes of a higher check in the future... seems rather silly, imo.

While headline CPI was 0% for the month to month, the CPI-W declined -0.1%. Both were largely a product of the decline in energy, specifically gasoline. Gasoline has already fallen on this date, by similar numbers as July. Which will be more than enough to offset the rise in groceries (more later on groceries). Gasoline should fall a bit further over the next week, but seems to be set to stabilize.

It might even offset any expected increases in "core" inflation. My August projection in the chart is for a range of -0.2% ~ +.01% month to month for CPI-W.  September CPI-W ranges from -0.3% ~ 0.0%. So while the chart plots the C.O.L.A. increase range as 8.6%~9.0%, the lower number is much more likely, imo.


So call me suspicious of "non-partisan" groups that have headlined the potential for 10%+ S.S.A. C.O.L.A. and their adoring "journalists" that published this information for seniors on Social Security to read. To get 10%+, you have to have at least one month above 10% and likely 2. We haven't had even one

It does make me wonder what the aim of those "reports" were? Further divisions? Which brings me to politics. One side of the aisle plays up the 0.0% change in M/M and the other side reminds us, it is still 8.5% Y/Y.

I may sound like the latter, given what I am about to say. But first, another chart (BLS sourced, except projections)...
When I earlier mentioned a near repeat of July's numbers for August, I was not kidding. Which brings me to food... something I rather enjoy. It also brings up the looming food insecurity and a phenomena called "hangry" . The latter of which is a smash-up of hungry and angry.

August's food at home will most likely be +14.3% Y/Y. How can I say this? This is the PPI (BLS) from July and while it was down -0.5%, that did not mean everything went down. NO! It did not!


Somehow I believe, some of this will get passed on. It is already an issue on the websites I frequent, just as gasoline prices were. Were, as in it has shifted to lower pump prices, but still unhappy, as it isn't what it was 1 year or 2 years ago. So remember the 2.0% finished consumer goods, one month jump of the PPI. It is coming to a home near you.

Food is becoming more and more the topic, with many expressing some form of hardship. What intrigues me, is they are still hanging on to their smart phones, internet connections, etc. 

However, there are people that either haven't had any of those items or have had to cut back. People do change their spending habits for one reason or another, but keeping food on the table is rather constant, imo. 

I am referring to the USA in this instance, as I cannot imagine the hardships being foisted on a large swath of the population in Europe. And as food is a global commodity... the rest of the world as well. Seriously, I cannot fathom what it is like in some areas of Africa where food scarcity is the issue.

Food scarcity... lack of basic nutritional food.
Food insecurity... inability to afford basic nutritional food.

We have enough angry people in the USA, without increasing food insecurity and making even more people angry or hangry

Which goes to show a tried and true historical method is once again being used. Our "elected leaders", "corporate masters", and their "media shills" must ensure we are blaming each other, rather than focusing on the real problem... which is "them".

I'm sure we will be informed how things are "looking up" or the "sky is falling". Most likely all spin, just like water circling the drain.  

Whew! I got that off my chest! Time for a nap?


Wednesday, August 10, 2022

Breakdown of CPI DATA and Real Earnings, July 2022

It is that time of month, to survey the damage from inflation. The BLS report was released this morning and it was a surprise. (historical releases)

This is what I projected for the month...

So, I will project 0.3%~0.5% month to month and a reading of 8.9%~9.1%. I fervently hope I am over shooting, this time. 

I did overshoot, as well as many others. 

The Consumer Price Index for All Urban Consumers (CPI-U) was unchanged in July on a seasonally adjusted basis after rising 1.3 percent in June, the U.S. Bureau of Labor Statistics reported today. Over the last 12 months, the all items index increased 8.5 percent before seasonal adjustment.
My own personal CPI was up a bit, after all the checks, credit cards, etc. were accounted for...

My annual rate is 7.8%, which is better than the CPI-U and CPI-W. Which brings me to the C.O.L.A. 

As July is 1/3 of C.O.L.A., it is very important. The forecast took quite a hit, from last month...

It would probably be best to state the 8.6%~9.0% is the high range, with expectations of a slide from there. 

However, while the CPI-U inflation number of 8.5% seems like an improvement, the food section is worrying. The report avoided the "food at home" on annual basis of 13.1%, although it did mention the 1.3% month to month rise, which is the 7th consecutive month of 1.0% or higher. Chew on that!!

While it is noted that gasoline fell, electricity has now risen 15.2% y/y and 3rd consecutive m/m increases of over 1%, with July at 1.6%.

The Real Earnings report also came out this morning...
Hooray, an uptick away from the downward trend, and getting closer to real earnings of pre-Covid.
Weekly earnings mirrored the hourly earnings. Both are due to a flat month to month CPI report, which is better than the opposite. Is it the start of a trend?

Not a bad set of number, considering the expectation. 

Now for next month's CPI-U, and here's hoping I am once again overshooting... month over month at 0.0%~0.2% and year to year of 8.3% to 8.5%. 

While gasoline is expected to have similar drops, relative to July's numbers... they are currently nearing their floor. The rest of the energy section will continue to rise, and likely food at home. This ain't over.

Even the 16% Trimmed Mean and the Median says it ain't over. Tomorrow's PPI might provide a hint.


Review of March 2024 data, 1Q GDP, PCE and personal income

The monthly summary is not so wonderful, incomparison... Inside all that pink is some troubling food related issues. Even though energy is s...