Showing posts with label natural gas. Show all posts

Friday, September 29, 2023

Natural Gas Summary, UK, EU, USA... Week Ending 9-29-2023

The Energy Information Administration released their weekly report


At long last, all regions are above both last year and 5 year average. Hooray!
EIA.GOV via SNL Energy
Now for a look at The European Union and United Kingdom.

[The reason for this observation is LNG, which has introduced the prospect of U.S. Natural Gas prices being affected by global demand for LNG. The EU and UK serve as a benchmark for these demand issues.]

Time to wrap up the publishing of this weekly natural gas summary...


Friday, September 22, 2023

Natural Gas Summary, UK, EU, USA... Week Ending 9-22-2023

The Energy Information Administration released their weekly report.


The Pacific Region has pushed above year ago levels and is very near the 5 year average.


Now for a look at The European Union and United Kingdom.

[The reason for this observation is LNG, which has introduced the prospect of U.S. Natural Gas prices being affected by global demand for LNG. The EU and UK serve as a benchmark for these demand issues.]

Data from the Aggregated Gas Storage Inventory report...


The United Kingdom continues to slide in percent of storage filled. It should be noted that UK does have access to natural gas supplies and infrastructure for LNG. However, the flip side is more abrupt changes in pricing.


Which is most noticeable in the forward futures, as shown on this chart.


The US market continues to be somewhat stable. 

Friday, September 15, 2023

Natural Gas Summary, UK, EU, USA... Week Ending 9-15-2023

The Energy Information Administration released their weekly report.

The Pacific Region has pushed above year ago levels and is nearing the 5 year average.
EIA.GOV, via SNL Energy

Now for a look at The European Union and United Kingdom.

[The reason for this observation is LNG, which has introduced the prospect of U.S. Natural Gas prices being affected by global demand for LNG. The EU and UK serve as a benchmark for these demand issues.]

Data from the Aggregated Gas Storage Inventory report...

The overall EU pct. slipped since last week, but the volume in storage increased, as capacity increased.

While the EU as a whole, has approximately 100 days of supply, it should be noted that days supply varies greatly within the individual countries. 

Prices edged up in the EU and UK.

U.S. Henry Hub finished the week down -3¢.


Both TTF (Dutch) and UKG remain approximately double historical norms. Henry Hub is running about 2/3 of those norms. 


Friday, September 8, 2023

Natural Gas Summary... Week Ending 9-08-2023

The Energy Information Administration released their weekly report.


The Pacific Region continues to be slightly ahead of year ago numbers, but still below the 5 year average, although still improving.

The South Central Region continued the slide against year ago levels, but is still above 5 year average.

EIA.GOV, via SNL Energy
Now for a look at The European Union and United Kingdom.

[The reason for this observation is LNG, which has introduced the prospect of U.S. Natural Gas prices being affected by global demand for LNG. The EU and UK serve as a benchmark for these demand issues.]

Data from the Aggregated Gas Storage Inventory report...

Data per AGIS
The UK continues to reduce inventory, while Austria and Belgium slipped from last report.


Overall, NatGas prices slipped compared to last week.


Friday, September 1, 2023

EU & UK NatGas Inventory Report, September 01, 2023

Data from the Aggregated Gas Storage Inventory report...

While up in most areas of Europe, Austria -.01%, Czech Republic -.02%, and the UK down -1.63%.

Pricing finds the U.S. back to normal, with the EU and the UK still elevated, as will likely continue for quite a period of time.


Thursday, August 31, 2023

U.S. NatGas Inventory Report, August 31, 2023

The Energy Information Administration released their weekly report today.


The Pacific Region is now slightly ahead of year ago numbers, but still below the 5 year average.

The South Central Region slipped below one year ago levels, but is still above 5 year average.

EIA.GOV, via SNL Energy
Nothing dramatic taking place, so steady as she goes, would be the best description, imho.


Friday, August 25, 2023

EU & UK NatGas Inventory Report, August 25, 2023

Data from the Aggregated Gas Storage Inventory report...


The storage continues to increase, and has surpassed same period of 2020.


Natural Gas prices moderated in both nearby and futures pricing, as the potential for a strike by Australian Unions at one LNG facility seemed to have abated. At least until another strike was threatened, which sent prices upward again... today.


While current prices in the EU and UK are below pricing of 2 years ago, they are still elevated compared to 2019 and 2020. Despite LNG exports, U.S. prices remain at 2019 and 2020 levels.

Thursday, August 24, 2023

U.S. NatGas Inventory Report, August 24, 2023

The Energy Information Administration released their weekly report today.


The Pacific Region continued to gain inventory, although still below one year ago and 5 year average.

The South Central region shed inventory over the week, yet remains well above year ago and 5 year average.
EIA.GOV, via SNL Energy
Generally speaking, natural gas prices are significantly below one year ago levels, and more in line with pre-covid levels. 

Current price levels suggest consumer inflation in natgas as well as pass through products (electricity) will continue to moderate. These products represent about 3.6% of the average consumer basket.


Friday, August 18, 2023

EU & UK NatGas Inventory Report, August 18, 2023

 Data from the Aggregated Gas Storage Inventory report...


Much is being made of the 90% achievement, 3 months early. Typically this would represent about 3 months of supply, if all sources were cut off. That will not happen, but winter expectations and potential Australian LNG strike has provided apprehension in the markets. That potential for less supply has sent the bidding upward.


Overall, the price of TTF NatGas is still below levels of 2 years ago -(13.2%). That was before the pipeline chicanery, blackmail, etc. 


U.S. NatGas Inventory Report, August 18, 2023

The Energy Information Administration released their weekly report yesterday.


The Pacific Region continues to be below year ago and 5 year averages, although significant gains from last week.
Price changes in California were mixed this week. The price at PG&E Citygate in Northern California fell 7 cents, down from $5.71/MMBtu last Wednesday to $5.64/MMBtu yesterday. The price at SoCal Citygate in Southern California increased $2.85 from $4.95/MMBtu last Wednesday to $7.80/MMBtu yesterday. El Paso Natural Gas Company reported maintenance on the North Mainline near Leupp, Arizona, beginning on Monday August 14. In addition, ongoing maintenance is occurring at the SoCalGas pipeline system. Prices in the West remain the highest in the country as above-average temperatures keep demand for cooling high and as the Pacific region remains the only region in the United States with below-average storage levels.

 
Henry Hub prices fell from last week, as well as on the futures market.


Friday, August 11, 2023

Natural Gas Inventory Report, August 11, 2023

The Energy Information Administration released their weekly report yesterday.

The Pacific Region continues to be below year ago and 5 year levels, but is slowly gaining.


Prices increased in West Coast markets, still the highest priced markets in the United States, except in Southern California where a large maintenance event concluded. The price at Sumas on the Canada-Washington border rose 37 cents from $3.72/MMBtu last Wednesday to $4.09/MMBtu yesterday, and the price at PG&E Citygate in Northern California rose 54 cents, up from $5.17/MMBtu last Wednesday to $5.71/MMBtu yesterday. 

 Select EU and UK storage...

Inventories continue to improve across the EU and UK. (100% inventory capacity is approximately a 90 day supply.)

Dutch and UK futures, surged 6% and 7% respectively over last week. February, 2024 futures, surged nearly 22% from last week.

Henry Hub futures surged 7% almost across the board.


The upward pressure stems from labor action in Australia, increased LNG demand in Asia, as well as a Norwegian pipeline tapering down to closure in early fall. The labor action had been somewhat anticipated, and certainly the latter two... were on tap. Or as Rumsfeld might have said... the labor action was a known unknown, and the latter were known knowns. 

So something else might be shaking the market.


Friday, July 28, 2023

Natural Gas Inventory Report, July 28, 2023

The Energy Information Administration released their weekly report yesterday.


The Pacific Region slipped to -8.3% from last week's -7.9% last week's numbers, although year ago numbers edged up to -13.1% from -13.4%
Across much of the West, prices increased this week, particularly in California. In the Rocky Mountain region, the price at Cheyenne Hub in southeast Wyoming rose 16 cents from $2.24/MMBtu last Wednesday to $2.40/MMBtu yesterday. In California, the price at PG&E Citygate in Northern California rose 40 cents, up from $4.89/MMBtu last Wednesday to $5.29/MMBtu yesterday. The price at SoCal Citygate in Southern California increased $6.69 from $5.64/MMBtu last Wednesday to $12.33/MMBtu yesterday.
Ouch!!

 Select inventories of EU and UK... 
It should be noted that while percent of capacity is high... that capacity is generally only about a 3 month supply. It is much better than years past, but still dependent on weather and geo-politics.

Total EU rose to 84.49%, from last week's 82.53%.


Snapshot of the past, the current and the future outlook for prices.


Friday, July 21, 2023

Natural Gas Inventory Report, July 21, 2023

The Energy Information Administration released their weekly report yesterday.

Nationally, the inventory number continue to stay above the 5 year seasonal average.


The Pacific Region continues to gain, with last week's numbers, at -7.9% vs. -9.3% of one year ago. The 5 year seasonal numbers continue to improve.
In California, the price at PG&E Citygate in Northern California rose 57 cents, up from $4.32/MMBtu last Wednesday to $4.89/MMBtu yesterday. The price at SoCal Citygate in Southern California increased $2.24 from $3.40/MMBtu last Wednesday to $5.64/MMBtu yesterday. Natural gas consumption in the electric power sector increased by 84% (1.3 Bcf/d) in California and by 10% (0.3 Bcf/d) in the desert Southwest this report week

 Select inventories of EU and UK... 

Total EU rose to 82.53%, from last week's 78.63%.

It should be noted that Gas in storage does not represent usage. An Example would be Germany has 212+ TWH in storage, but consumed approximately 847 TWH in 2022, which was a 17% decrease from 2021.

The following contains pricing information, that is based in Mmbtu and converted to US dollars for comparison purposes only. Forex is used for this comparison and should be noted that actual exchange rates on delivery may vary. 

Simply put... The EU and UK consumers do not use US Dollars, so be wary of these charts.


Snapshot of the past, the current and the future outlook for prices.
Just for comparison, the UK current pricing would suggest £1,522.06 per annum, while the 12 month high (FEB-24) would suggest £2,286.37. OFGEM has a cap around £2,047, which is line with the October futures.

Friday, July 14, 2023

Natural Gas Inventory Report, July 14, 2023

The Energy Information Administration released their weekly report yesterday.

Nationally, stocks continue to be above the mid point of 5 year range. However... once again the Pacific.

While the Pacific gained this past week, it only matched the curve for time of year.
Prices increased in most West Coast markets this week, except at SoCal Citygate in Southern California, where the price decreased 45 cents from $3.85/MMBtu last Wednesday to $3.40/MMBtu yesterday. Natural gas consumption in California declined 8% (0.4 Bcf/d) week over week, led by a 26% (0.5 Bcf/d) decrease in consumption in the electric power sector, according to data from S&P Global Commodity Insights. 

Select inventories of EU and UK... 

Total percent of capacity rose this past week to 80.76%.

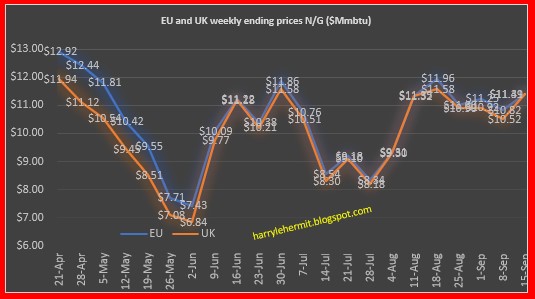
The near term Natural Gas Prices for the EU and UK fell this past week. (Note: figures are in dollar terms and Mmbtu.)
Not surprisingly, the high 12 month also slipped. Currently that 12 month high is January, 2024.

Just for comparison, the UK current pricing would suggest £1,484.27 per annum, while the 12 month high (Jan-24) would suggest £2,235.81. OFGEM has a cap around £2,047, which is line with the October/November futures. (Note: The OFGEM cap reduction is more of a reduced consumption number, not so much as lower price per unit. Make of that, as you wish.)


While it could be said that EU and UK natural gas prices are skirting with levels not seen in 2 years, there is still angst in their markets. 


1-17-2025 Week In Review

Laugh of the week Watching Sky News and a lady proclaimed that social media sites should be held to the same strict standards as newspaper p...