Showing posts with label CPI-W. Show all posts

Wednesday, April 10, 2024

BLS Data Dump. CPI - April 10th, 2024

First up is the BLS Report for CPI...(historical releases)

The Consumer Price Index for All Urban Consumers (CPI-U) increased 0.4 percent in March on a seasonally adjusted basis, the same increase as in February, the U.S. Bureau of Labor Statistics reported today. Over the last 12 months, the all items index increased 3.5 percent before seasonal adjustment.

The index for shelter rose in March, as did the index for gasoline. Combined, these two indexes contributed over half of the monthly increase in the index for all items. The energy index rose 1.1 percent over the month. The food index rose 0.1 percent in March. The food at home index was unchanged, while the food away from home index rose 0.3 percent over the month.

Here is the unadjusted CPI for the past 12 months...

My own personal CPI rose 3.0% Y/Y and 0.6% on the month...

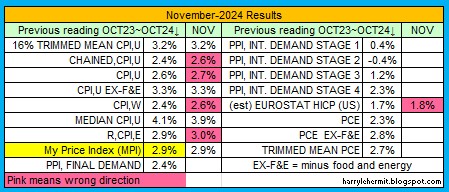
Taking a look at the report card...


Not real pretty, imho. It should be noted the release partially laid the surge in inflation at the feet of energy. True on a monthly basis, but Y/Y is up 2.1%, compared to the headline of 3.5%. Even food was at 2.2%, so start looking much harder within that CPI ex food and energy number of 3.8%.

Speaking of food...


Hidden in all those numbers and weightings... food away from home ease barely above January, 2021 numbers. That is NOT adjusted for inflation, but in current dollars. I can't help but think the entities making up the food away from home category... is struggling.  

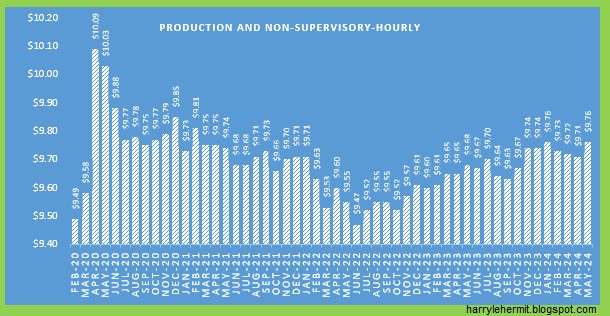
As for Real Earnings.

An increase of 4¢ from February, 2020. It is important to adhere to that timing, as it was before the disruption of the workforce, cue to covid.


The overall report does show some stagnation for wage growth. Hard to make anything uplifting from the data. 

Sorry!


Tuesday, March 12, 2024

BLS Data Dump. CPI - March 12th, 2024

First up is the BLS Report for CPI...(historical releases

The Consumer Price Index for All Urban Consumers (CPI-U) increased 0.4 percent in February on a seasonally adjusted basis, after rising 0.3 percent in January, the U.S. Bureau of Labor Statistics reported today. Over the last 12 months, the all items index increased 3.2 percent before seasonal adjustment.

The index for shelter rose in February, as did the index for gasoline. Combined, these two indexes contributed over sixty percent of the monthly increase in the index for all items. The energy index rose 2.3 percent over the month, as all of its component indexes increased. The food index was unchanged in February, as was the food at home index. The food away from home index rose 0.1 percent over the month.

While the chart below shows the past 12 months, it should be noted the end of 2022 also saw a downward trend, prior to 2023 rises. The February number continues the 2023 1st quarter upward swing.

On the other hand, my own personal CPI rate has continued upward, albeit not as high as the CPI-U.

That is 2.5% annual, with another sharp 0.4% increase for February. The reason last month was the medical category, but is more evenly spread for this month. My worse fear being that my personal rate is edging up towards the CPI-U rate, which seems mired in a narrow range.

The R-CPI-E did ease from last month's annual of 3.5% to this month's annual of 3.4%. The month to month was still at +0.6%, but is more of a rounding issue. Last month was +0.635% and this month at +0.554%.

Across the board resulted in this picture...

As for Real Earnings.

Not such a good report, as indicated by this graph...

While the downward spike of 3¢ per hour might not seem large, it follows downward revisions in two previous months. Revisions are a normal part of the process, but a troubling trend is frequency of downward revisions in previous month's data. This tends to enhance the belief of manipulation in an election year.

This follows the pattern of jobs, GDP, etc. Not a real confidence builder, imo.


Tuesday, February 13, 2024

BLS Data Dump. CPI - February 13, 2024

First up is the BLS Report for CPI...(historical releases)

The Consumer Price Index for All Urban Consumers (CPI-U) increased 0.3 percent in January on a seasonally adjusted basis, after rising 0.2 percent in December, the U.S. Bureau of Labor Statistics reported today. Over the last 12 months, the all items index increased 3.1 percent before seasonal adjustment.

The index for shelter continued to rise in January, increasing 0.6 percent and contributing over two thirds of the monthly all items increase. The food index increased 0.4 percent in January, as the food at home index increased 0.4 percent and the food away from home index rose 0.5 percent over the month. In contrast, the energy index fell 0.9 percent over the month due in large part to the decline in the gasoline index.

While the chart below shows the past 12 months, it should be noted the end of 2022 also saw a downward trend, prior to 2023 rises. The January number reverses the 2023 fall downward trend and achieves an all time high.


On the other hand, my own personal CPI rate has continued upward, with a decent jump last month.


That is 2.3% annual, with a sharp 0.6% increase for January. The reason mainly being under the medical category and the fact it takes up much more weight, than the BLS weighting does. Hopefully that trend doesn't continue, but after all the "medical" adjustment to the CPI now finished... look out! 

As a side note the R-CPI-E was up 0.6% for the month and 3.5% annual. (R-CPI-E= Research consumer price index for Americans age 62 years of age and older).

Also, the gasoline index is now popping, after actually falling in January. Again... look out!!

As for Real Earnings.


Weekly wages seem to be slowing for some reason, which is reflected across the board, to the working stiffs.


Not a really bad report, but be on the outlook for any worrying trends to develop, imho.

Still, the overall seems to be easing off, even if a hiccup here and there. 

Thursday, January 11, 2024

BLS Data Dump. CPI - January 11, 2024

First up is the BLS Report for CPI...(historical releases)

Not sure what the hoopla is about, regarding coming in hotter than expected. Factoring the rounding, it was just a few basis points above my expectations.

The index for shelter continued to rise in December, contributing over half of the monthly all items increase. The energy index rose 0.4 percent over the month as increases in the electricity index and the gasoline index more than offset a decrease in the natural gas index. The food index increased 0.2 percent in December, as it did in November. The index for food at home increased 0.1 percent over the month and the index for food away from home rose 0.3 percent. 

I highlighted a portion of that statements, as it is weird as heck. Gasoline in the November report was 297.598 and December gave a 280.289. Granted that is "unadjusted", but seriously... where did the increase in gasoline index come from? Nationally, the prices are down from last month, about 18¢ and down about 9¢ from December of 2022. Yet, somehow the "seasonally adjusted" edged up enough to offset something else.

Even by the BLS numbers from December, 2022... gasoline fell -1.5% (unadjusted)  on the month and was -9.4% on the seasonal adjustments. December, 2023... saw gasoline fall -1.9% on the unadjusted monthly, ... but rose +0.2 of the seasonal adjustments.  

In any case, the top number has decreased for 3 consecutive months. Now that would be seasonal, as November and December of 2022... saw decreases. It reversed in the January 2023 report.

My own personal CPI looks like this...
That is a +2.2% increase annually, and +0.1% for the month.

As for Real Earnings.


Remember when covid disrupted everything and massive shutdowns, layoffs, etc. Comparing that $380.95 real weekly earning, compared to February, 2020's $378.92. 

It is better than nothing!

Tuesday, December 12, 2023

BLS Data Dump. CPI - December 12, 2023

First up is the BLS Report for CPI...(historical releases)

The Consumer Price Index for All Urban Consumers (CPI-U) increased 0.1 percent in November on a seasonally adjusted basis, after being unchanged in October, the U.S. Bureau of Labor Statistics reported today. Over the last 12 months, the all items index increased 3.1 percent before seasonal adjustment.

I think the numbers were somewhat in line with everyone's expectations.

I do find the food portion of the darn thing a bit intriguing.


While the overall index has increased 17.4% since January, 2021, the food at home index has jumped 20.3%

Oddly, when adjusting the index to "average" household spending the food at home has jumped 29.6%, in current dollars.

What really catches the eye, is the -8.5% drop in current dollars for food away from home. This would be cafeterias, restaurants, and other places "away" from home.

This type of comparison with weightings against the index, further indicates a drop in current dollar spending for food in all categories... compared to rate of inflation.


The CPI index has an increase in prices of 20%, yet current dollar spending is 11.6%. The food away from home industry is not keeping up, as I suspect more meals are prepared at home... or people are cutting back on eating. [NOT]


Real average hourly earnings for all employees increased 0.2 percent from October to November, seasonally adjusted, the U.S. Bureau of Labor Statistics reported today. This result stems from an increase of 0.4 percent in average hourly earnings combined with an increase of 0.1 percent in the Consumer Price Index for All Urban Consumers (CPI-U).

Here is a graph...


Tis a nickel better than February, 2020. Merry Christmas!


Thursday, October 12, 2023

BLS Data Dump. CPI - October 12, 2023

First up is the BLS Report for CPI...(historical releases)

The Consumer Price Index for All Urban Consumers (CPI-U) rose 0.4 percent in September on a seasonally adjusted basis, after increasing 0.6 percent in August, the U.S. Bureau of Labor Statistics reported today. Over the last 12 months, the all items index increased 3.7 percent before seasonal adjustment.

The index for shelter was the largest contributor to the monthly all items increase, accounting for over half of the increase. An increase in the gasoline index was also a major contributor to the all items monthly rise. While the major energy component indexes were mixed in September, the energy index rose 1.5 percent over the month. The food index increased 0.2 percent in September, as it did in the previous two months. The index for food at home increased 0.1 percent over the month while the index for food away from home rose 0.4 percent. 

The index for all items less food and energy rose 0.3 percent in September, the same increase as in August. Indexes which increased in September include rent, owners' equivalent rent, lodging away from home, motor vehicle insurance, recreation, personal care, and new vehicles. The indexes for used cars and trucks and for apparel were among those that decreased over the month.

I had readings of 3.6%~3.9%, so the 3.7% was within that range.

The past 12 months...

My own CPI...
The C.O.L.A. was announced at 3.2%.

The results, compared to average S.S. income and various CPI methods. Once the average monthly S.S. is adjusted for Medicare Part B, the result is 2.9%.

Then compare the average 3 month of each CPI method, yields the headline CPI of 3.5%; Chained CPI at 3.6%; R-CPI-E at 4.1%; the end result of S.S. monthly minus projected Medicare part B... stands in sharp contrast to actual inflationary pressures.


'Nuff said!

This concludes my monthly publication of CPI.


Wednesday, September 13, 2023

BLS Data Dump. CPI - September 13, 2023

First up is the BLS Report for CPI...(historical releases)

The Consumer Price Index for All Urban Consumers (CPI-U) rose 0.6 percent in August on a seasonally adjusted basis, after increasing 0.2 percent in July, the U.S. Bureau of Labor Statistics reported today. Over the last 12 months, the all items index increased 3.7 percent before seasonal adjustment.

The index for gasoline was the largest contributor to the monthly all items increase, accounting for over half of the increase. Also contributing to the August monthly increase was continued advancement in the shelter index, which rose for the 40th consecutive month. The energy index rose 5.6 percent in August as all the major energy component indexes increased. The food index increased 0.2 percent in August, as it did in July. The index for food at home increased 0.2 percent over the month while the index for food away from home rose 0.3 percent in August. 

Depending on which consensus forecast you use, this was either slightly above or slighty below.

It was slightly below my chosen group. I had mentioned +0.8% increase, versus +0.6% actual. Both the month to month and annual were slightly below my chosen group's forecast. +3.8% versus +3.7%.

The actual readings.

Then there is my personal results, which is important to me. +0.4% M/M and +1.8% Annual.
Now for the C.O.L.A projections...


I can nearly predict the C.O.L.A will be +3.2%. This is based on the expecation the minimum September number would be 301.829 (+0.09%) and the maximum being 302.704 (+0.038%). Given current forecasts, the September numbers should be in this range. 

Considering that the C.O.L.A is nearly set at 3.2%, it is time to look at impact on old folks, such as myself. While mine edged up this month, the R-CPI-E, is well above the 3.2% C.O.L.A. at 4.2%. R-CPI-E stands for Research CPI Experimental, not the retired cpi elderly, that some people think. However, it was experimental research targeting 62 year olds and over. 

For years the Medicare B standard rates were announced in November. Last year the Biden Adminstration had it announced almost simultaneously with the C.O.L.A. While the Biden White House ballyhooed the 8.7% C.O.L.A. as an achievement, then quickly caught flak for taking credit for inflation, they were able to rejoice in the Medicare B standard rates falling. 

With the likelihood of Medicare B standard rates being raised... Gee, I wonder when that announcement will come?

With the headline CPI being 3.2% in July, and currently 3.7% for August, the September forecast of 3.6% will come out... just as that likely 3.2% C.O.L.A. is announced.

This is called a political dilemma.

Of course, no one is mentioning the real earnings report, which I will delve into next.


Thursday, August 10, 2023

CPI Latest DATA results, August 10, 2023

The BLS report was released this morning and it was at consensus estimates. (historical releases)

The Consumer Price Index for All Urban Consumers (CPI-U) rose 0.2 percent in July on a seasonally adjusted basis, the same increase as in June, the U.S. Bureau of Labor Statistics reported today. Over the last 12 months, the all items index increased 3.2 percent before seasonal adjustment.

The index for shelter was by far the largest contributor to the monthly all items increase, accounting for over 90 percent of the increase, with the index for motor vehicle insurance also contributing. The food index increased 0.2 percent in July after increasing 0.1 percent the previous month. The index for food at home increased 0.3 percent over the month while the index for food away from home rose 0.2 percent in July. The energy index rose 0.1 percent in July as the major energy component indexes were mixed.

The rates on the graph, averaged 3.5% during that 75 year period. The past ten years averaged 2.7%, and the 10 year pre-covid rate was 1.7%. The 21st century average is 2.5%. Pick your normal.

While last month's 3.0% and this month's 3.2% are below the 75 year average, not exactly better than either of the 10 year marks, nor the 21st century average.

The past 28 months have seen food at home risen 20.4% (8.74% annualized), and the overall CPI up... 16.9% (7.24% annualized).

That is something very fresh in the minds of many Americans.

In the absolutely to early to project something, but I can't help myself category... the current outlook for C.O.L.A.

So far this month...
Time for some more graphs...
It should be noted, the July, 22 ~ December, 22 period was nearly flat. Since then, the rate of inflation has had an upward trajectory.

My personal CPI rate is better than expected. but still not pleasing to me. 
There seems to be some euphoria over today's report, which seems to be based on inflation matching consensus expectations, although a bit higher than next month.

Which brings me to expectations for the current month. Nearly everything I've read indicates a higher print for next month. I haven't read any consensus expectations, but the range is much higher. With energy prices jumping upward, as well as food prices... core will need to slow down to bring the August numbers within range of July, imho.

Wednesday, July 12, 2023

CPI Latest DATA results, July 12, 2023

The BLS report was released this morning and it was a shade below consensus estimates. (historical releases)

The consensus: 0.2% increase in CPI (monthly); 0.3% increase in core CPI (monthly); 3.0% Y-Y CPI; and core 5.0% Y-Y. The result: 0.2% CPI (monthly); 0.2% core (monthly); Y-Y CPI at 3.0%; and core at 4.8% Y-Y. The Consumer Price Index for All Urban Consumers (CPI-U) rose 0.2 percent in June on a seasonally adjusted basis, after increasing 0.1 percent in May, the U.S. Bureau of Labor Statistics reported today. Over the last 12 months, the all items index increased 3.0 percent before seasonal adjustment.

The index for shelter was the largest contributor to the monthly all items increase, accounting for over 70 percent of the increase, with the index for motor vehicle insurance also contributing. The food index increased 0.1 percent in June after increasing 0.2 percent the previous month. The index for food at home was unchanged over the month while the index for food away from home rose 0.4 percent in June. The energy index rose 0.6 percent in June as the major energy component indexes were mixed.

A lot was made about the year over year dropping for 12 consecutive months. It has, but that party is coming to an end, as July is set to pop up by +0.34% to +3.4% annual, and core up +0.4%, to +4.8% annual.

For some reason, the idea that 3.0% annual is normal!


Since January 1948~ January 2021, the average has been 3.5%, so it could be said 3.0% is normal. However, the 21st century up to January 2021... saw an average of 2.1%. So which "normal" is it?

While the report seems to be "good', let's not forget the index has risen 16.6% in 27 months and the cost of food at home has risen 19.9% during the same period.

The notion that consumers are under less stress due to this report is baffling. It is still an increase in most everything... except gasoline and energy et al. 

In the absolutely to early to project something category... the current outlook for C.O.L.A.

So far this month...

Time for more graphs... past 12 month CPI readings.
June, 2022 was the peak of annual inflation at 9.1%. Inflation for the following 6 months was 0.2% or 0.4% annualized. The major driver in those numbers were the dropff in energy prices. The following 6 months saw prices increase 2.8% or 5.6% annualized, as energy prices stabilized.  

To repeat the 2.97% annual inflation for next month would require a flat month to month CPI. That would require an extraordinary drop off from current expectations. Energy looks to be stable, so where would such a dropoff take place?

And finally... My CPI over the past 12 months.
Next up is the "Real Earnings Report".


Tuesday, June 13, 2023

CPI Latest DATA results, June 13, 2023

The BLS report was released this morning and it was a shade below consensus estimates. (historical releases)

The Consumer Price Index for All Urban Consumers (CPI-U) rose 0.1 percent in May on a seasonally adjusted basis, after increasing 0.4 percent in April, the U.S. Bureau of Labor Statistics reported today. Over the last 12 months, the all items index increased 4.0 percent before seasonal adjustment.

The index for shelter was the largest contributor to the monthly all items increase, followed by an increase in the index for used cars and trucks. The food index increased 0.2 percent in May after being unchanged in the previous 2 months. The index for food at home rose 0.1 percent over the month while the index for food away from home rose 0.5 percent. The energy index, in contrast, declined 3.6 percent in May as the major energy component indexes fell.

I read some reports how inflation came in well below expectations. Apparently those expectations got inflated prior to this release. The expected inflation Y/Y was 4.13% and this report came in at 4.048%.

It goes without saying that energy costs going down is a major factor in these lower inflation rates.

Yes, today's release is the lowest since March, 2021. However, the period since that date has seen overall prices increase 14.82% in that 26 month period. Which matches the rise of prices from August, 2012 until March, 2021. A period of 103 months.

Here is some food for thought. Food at home, has risen 19.5% in the 26 months, since March, 2021. It rose 19.5% from May, 2008, until March, 2021... a period of 102 months.

Those stats are a bit hard to chew.

So yes, inflation is slowing and should continue to slow. But once again, without the energy component, and the food component... prices increased 5.3%. Food was generally flat for the month, but still up 5.8% Y/Y.

My own personal CPI...
The current report card...

It is down across the board and hopefully... will continue to slide. 


Wednesday, May 10, 2023

CPI Latest DATA results, May 10, 2023

The BLS report was released this morning and it was a shade below consensus estimates. (historical releases)

The Consumer Price Index for All Urban Consumers (CPI-U) rose 0.4 percent in April on a seasonally adjusted basis, after increasing 0.1 percent in March, the U.S. Bureau of Labor Statistics reported today. Over the last 12 months, the all items index increased 4.9 percent before seasonal adjustment.

The index for shelter was the largest contributor to the monthly all items increase, followed by increases in the index for used cars and trucks and the index for gasoline. The increase in the gasoline index more than offset declines in other energy component indexes, and the energy index rose 0.6 percent in April. The food index was unchanged in April, as it was in March. The index for food at home fell 0.2 percent over the month while the index for food away from home rose 0.4 percent.

For the record, some rounding makes this appear much better. Last month's 5.0% was 4.98%, and this month's 4.9% is 4.93%.

The all items less food and energy index rose 5.5 percent over the last 12 months. (5.52%)

That compared to 5.6%, last month. (5.59%)

My own personal CPI...

Note that both CPI-W and Chained CPI edged up.

So once again, I should be happy with my index showing only 3.8%, but that is misleading. Remember, that COLA adjustment that came into effect in January, 2023? That made us whole back to 3rd quarter, 2021.

Any COLA for January, 2024, will most likely be in the >3.4% range. That 3.8% is operating at a loss.

As always, I keep track of my expenses, weighting, etc. Yours may be different.  


Wednesday, April 12, 2023

CPI Latest DATA results, Reports for March 2023

The BLS report was released this morning and it was a shade below consensus estimates. (historical releases)

The Consumer Price Index for All Urban Consumers (CPI-U) rose 0.1 percent in March on a seasonally adjusted basis, after increasing 0.4 percent in February, the U.S. Bureau of Labor Statistics reported today. Over the last 12 months, the all items index increased 5.0 percent before seasonal adjustment.

The index for shelter was by far the largest contributor to the monthly all items increase. This more than offset a decline in the energy index, which decreased 3.5 percent over the month as all major energy component indexes declined. The food index was unchanged in March with the food at home index falling 0.3 percent.

The index for all items less food and energy rose 0.4 percent in March, after rising 0.5 percent in February. Indexes which increased in March include shelter, motor vehicle insurance, airline fares, household furnishings and operations, and new vehicles. The index for medical care and the index for used cars and trucks were among those that decreased over the month.

A couple of notes... "all major components declined". That is with "seasonal" adjustment. While the overall index eased, the gasoline component was up +1.0% and is currently on the rise for April, as in +3.0%. Be careful of the spin.

Food at home, did drop, but that food away from home... seems to be hanging tough.

The real story is sticky prices, or Core, or CPI ex- food and energy. It actually rose on an annual basis, and was above expectations on the monthly. It would have been even worse, but the Medical side inexplicably fell. If it had remained flat, you could add another +0.1% to that Core.

Simply looking at the core at 5.6%, with the overall being 5.0%... should tell you that drops in energy is where the most savings are. Further browsing through the numbers, indicate most items, other than gasoline are where those savings are. How much longer can that last?

The forecast indicates an increase in Core, with the overall remaining at current level of +5.0%. So clearly the big brains think it will continue. The may be right, but the politics of pump prices, tends to overshadow all the other energy components. 

Generally speaking, those winter heating bills drop and consumers don't really recognize the cost per unit difference. Gasoline is right in your face at the pump... and everyone seems to recognize that cost per unit.

My own personal CPI...
I guess I should be happy with the +0.1% M/M, and +4.0% Y/Y, but I don't like inflation of any type. 


Tuesday, March 14, 2023

CPI DATA results, March Reports 2023

The BLS report was released this morning and it was a shade above consensus estimates. (historical releases)

The Consumer Price Index for All Urban Consumers (CPI-U) rose 0.4 percent in February on a seasonally adjusted basis, after increasing 0.5 percent in January, the U.S. Bureau of Labor Statistics reported today. Over the last 12 months, the all items index increased 6.0 percent before seasonal adjustment.

The index for shelter was the largest contributor to the monthly all items increase, accounting for over 70 percent of the increase, with the indexes for food, recreation, and household furnishings and operations also contributing. The food index increased 0.4 percent over the month with the food at home index rising 0.3 percent. The energy index decreased 0.6 percent over the month as the natural gas and fuel oil indexes both declined.

The index for all items less food and energy rose 0.5 percent in February, after rising 0.4 percent in January. Categories which increased in February include shelter, recreation, household furnishings and operations, and airline fares. The index for used cars and trucks and the index for medical care were among those that decreased over the month.

The all items index increased 6.0 percent for the 12 months ending February; this was the smallest 12-month increase since the period ending September 2021. The all items less food and energy index rose 5.5 percent over the last 12 months, its smallest 12-month increase since December 2021. The energy index increased 5.2 percent for the 12 months ending February, and the food index increased 9.5 percent over the last year. 

Click image to enlarge

That's all from the BLS. Now on to my inflation stats. Which receded annually to 5.0% and 0.2% month to month.
Click image to enlarge
I would hope for a repeat during March, but with nearly half the month already gone... it is looking a bit iffy. 

Overall, the inflation outlook is improving, but still some pinkish areas overall. The PPI report tomorrow might provide a better outlook.
Click image to enlarge
Most everything I have read, indicates the CPI report was "close" to expectations. The upside surprise was the Core figures, which were tad above expectations. 

Which brings me to the March expectations. Everything I am reading indicates next month's release will have a much lower rate of inflation, as in 5.2% range. However, core is expected in the range of 5.7%, or to increase. Also on the month to month.

For that to happen the non core part - food and energy,  would have to drop fairly sharply. Not really seeing it at this point.

Tuesday, February 14, 2023

CPI DATA results, February Reports 2023

The BLS report was released this morning and it was a shade above consensus estimates. (historical releases)

The Consumer Price Index for All Urban Consumers (CPI-U) rose 0.5 percent in January on a seasonally adjusted basis, after increasing 0.1 percent in December, the U.S. Bureau of Labor Statistics reported today. Over the last 12 months, the all items index increased 6.4 percent before seasonal adjustment.

The index for shelter was by far the largest contributor to the monthly all items increase, accounting for nearly half of the monthly all items increase, with the indexes for food, gasoline, and natural gas also contributing. The food index increased 0.5 percent over the month with the food at home index rising 0.4 percent. The energy index increased 2.0 percent over the month as all major energy component indexes rose over the month.

Click to Enlarge
Click to Enlarge

It would seem the food at home index is getting a lot of attention. The concept that things are really getting better in this area. 

Click to Enlarge
Aside from the dip in November, the prices have been increasing. Of course, that didn't prevent one wag from looking at the wrong line on the report and coming up with something called a 3 month average, annualized, as proof that things are trending downward. 

Except, the downward trend, sharply ended a couple of months ago, and is now on the rise. Using the correct line from the report, yields this...
Click to Enlarge
So yes, this method does indicate a number below the y/y, but is now indicating 2 consecutive months of upward movement. The M/M unadjusted was +0.8%, or annualized to 9.6%. Not far from the y/y rate of 10.1%.

I get the distinct impression the CPI coming up above expectations, is being rationalized with but, but, but arguments.

Not sure how these arguments can hold up, but we Americans are easily manipulated. Actually, people around the globe are much the same.

Review of March 2024 data, 1Q GDP, PCE and personal income

The monthly summary is not so wonderful, incomparison... Inside all that pink is some troubling food related issues. Even though energy is s...