With the United Kingdom, Canada and EUstats release of April data, I have updated my comparison graph. [Note, the USA(EU method) is directly from Eurostat with the exception of April-2024. That data was calculated by me]
Inflation across these countries are now very similar, after some issues early on.
A reminder, that U.S. inflation rose upward in advance of those other countries.
While it has been popular, of late to say inflation was everywhere... it wasn't until it was. The period between was called "transistory".
There were factors unique to the U.S., as well as those other countries in the EU, as well as the U.K.
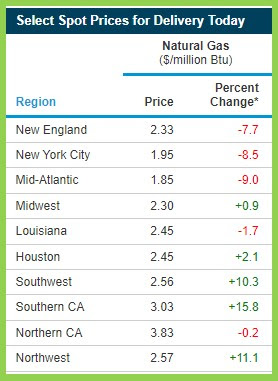
Unique to the E.U. and U.K. were natural gas issues over Ukraine/Russia
Unique to the U.S. were...
- Rapid roll out of vaccines
- Proclamations of Covid being whipped.
- Massive stimulus mailed directly to households, plus government programs
- Refinery outages in Texas.
- Am eminent dock workers strike, that didn't take place.
Common to both...
- Low petroleum and petroleum product inventories
- Container congestion, due to empty containers in all the wrong places.
- European decision to curtail NG and petroleum imports from Russia.
So the finger pointing becomes clear, when comparing the conditions that were in place, the actions taken + direct results, etc.