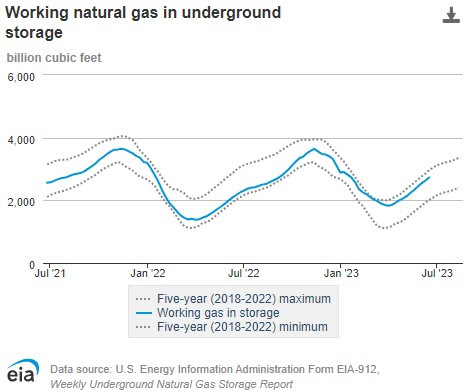
The Energy Information Administration released their weekly report yesterday.

As always... the Pacific Region...

Prices increased in all West Coast markets this report week. At PG&E Citygate in Northern California, the price rose 96 cents from $3.02/MMBtu last Wednesday to $3.98/MMBtu yesterday. The price at SoCal Citygate in Southern California increased 3 cents from $4.80/MMBtu last Wednesday to $4.83/MMBtu yesterday. The price at Sumas on the Canada-Washington border rose 59 cents from $2.02/MMBtu last Wednesday to $2.61/MMBtu yesterday.
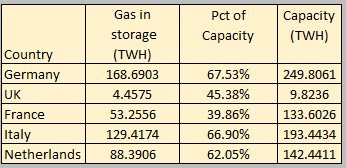
Select inventories of EU and UK...

A brief look at the 12 month highs for futures... TTF (EU) and UKG (UK).

A slight uptick for the 12 month, but still below the 5-5 picture.
Current week ending prices...

Current futures (August v 12 month high)

Basically, the current futures are about where they were 2 years ago, when the EU was worried about Russia messing with natural gas deliveries and woefully inadequate natural gas stocks.
Has the storm been weathered?