The Energy Information Administration released their weekly report today...
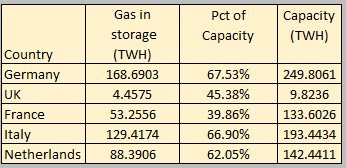
Nationally, not too bad for inventories, although some areas being lighter than others.
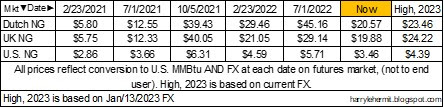
Prices have slipped a bit over the past couple of weeks, which is good news.
Now for a mixture of international politics and trade. Europe has been screaming from the rooftops about the new U.S. legislation that benefits U.S. based manufacturers. If there was not a war in Ukraine, would that be such a "major" issue?
Much of Europe's industrial strength was derived from cheap Russian energy imports, especially natural gas. Since the invasion, prices of natural gas has mushroomed, with new contracts being written at much higher costs to European industry. Futures indicate this will continue for a couple of more years, at a minimum.
As a result, many European companies can no longer compete with the U.S. on a cost per unit basis and have publicly stated that moving of operations is a viable alternative. This is the hollowing out of the European industrial base, that is sometimes mentioned.
The new U.S. legislation may indeed have some WTI violations and may receive some minor "tweaks", but the uproar is a smokescreen to cover for what is about to transpire. European companies, heavily dependent on natural gas, will being shifting to the U.S., or somewhere with cheaper natural gas.
Every good politician understands the importance of blame assignment. In this case, they are diverting the public's attention to a small blip in a trade document, and hope the public continues to blame the U.S. as their industrial based is hollowed out... due to high energy prices. Let's face it... many Europeans already blame the U.S. for everything bad that happens to them.
Certain publications that serve as mouthpieces for those countries' governments, are beating that drum really hard.
Buckle up... It will be interesting, in my humble opinion.


