Showing posts with label CPI-W. Show all posts

Thursday, January 12, 2023

CPI DATA and Real Earnings, January Reports 2023

The BLS report was released this morning and it was within target range. (historical releases)

The Consumer Price Index for All Urban Consumers (CPI-U) declined 0.1 percent in December on a seasonally adjusted basis, after increasing 0.1 percent in November, the U.S. Bureau of Labor Statistics reported today. Over the last 12 months, the all items index increased 6.5 percent before seasonal adjustment.

The index for gasoline was by far the largest contributor to the monthly all items decrease, more than offsetting increases in shelter indexes. The food index increased 0.3 percent over the month with the food at home index rising 0.2 percent. The energy index decreased 4.5 percent over the month as the gasoline index declined; other major energy component indexes increased over the month.

Much is made of the CPI decline over the past six months, but there is a recurring theme...

The index for gasoline was by far the largest contributor to the monthly all items decrease, more than offsetting... [insert item]

My CPI continues to improve...


Hourly earnings have just about caught up with pre covid earnings. Real Earnings
It is now a mere 1¢ below February 2020 level per hour. Weekly earnings are still -$1.30 to February 2020. Almost there.
Pump prices have leveled off. Other energy prices will level off very soon. Both will start to rise going forward into the summer months.

Core inflation has been mainly in check for the past three months due to adjustments in the medical area, as well as a continuing slide in used car prices. The Medical adjustments were a 4th quarter one and-done. The used car slide may continue.

Maybe I am a cup-half-empty guy, but I don't see inflation returning to acceptable levels before the fall. 

However, a recession might bring it down faster.  


Tuesday, December 13, 2022

CPI DATA and Real Earnings, December Reports 2022

The BLS report was released this morning and it was a surprise. (historical releases) It came in substantially under the forecast by everyone.

Last month, I projected this...

Range of 7.6%~7.9%. Sure things are moderating, but can we count on further reductions in Electricity, Utility (piped) gas service, apparel, Used cars and trucks, and Medical Care services? 

The answer to the question is yes. 

The Consumer Price Index for All Urban Consumers (CPI-U) rose 0.1 percent in November on a seasonally adjusted basis, after increasing 0.4 percent in October, the U.S. Bureau of Labor Statistics reported today. Over the last 12 months, the all items index increased 7.1 percent before seasonal adjustment.

The index for shelter was by far the largest contributor to the monthly all items increase, more than offsetting decreases in energy indexes. The food index increased 0.5 percent over the month with the food at home index also rising 0.5 percent. The energy index decreased 1.6 percent over the month as the gasoline index, the natural gas index, and the electricity index all declined.

The past 5 months (June to November) has been at an annualized rate of +1.13%. For comparison, the previous 5 months of January through June was an annualized rate of +12.94%. A major improvement in inflation, although it could be due to lower demand. Have to wait and see. 

For the first time in quite a long time, my monthly change was negative. Using the aforementioned 5 month ranges, the last 5 months was at annualized +1.41%, compared to prior 5 month annualized, of +10.94%. For year over year, My CPI stands at +6.7%

Hourly earnings have just about caught up with pre covid earnings. Real Earnings

I have done such a bang up job on predictions, I will not make any bold predictions for the future, although significant easing of energy prices is underway... although I suspect that might come to an end very soon. 


Thursday, November 10, 2022

CPI DATA and Real Earnings, November 2022

The BLS report was released this morning and it was a surprise. (historical releases) It came in substantially under the forecast by everyone.

My forecast from last month...

Oh yeah... next month CPI at 8.1%~8.2%, with m/m of +0.8%.

As you know by now...

The Consumer Price Index for All Urban Consumers (CPI-U) rose 0.4 percent in October on a seasonally adjusted basis, the same increase as in September, the U.S. Bureau of Labor Statistics reported today. Over the last 12 months, the all items index increased 7.7 percent before seasonal adjustment.

Of course, just as their is a silver lining inside every dark cloud, there can be a dark lining inside a silver cloud. Such as the month over month of July, at -0.01%; August at -0.04%; September at +0.22%; and this report (October) at +0.41%. Still not bad. 


My month over month was +0.08% and annual at 7.41% after last month's +0.33% mom and annual at 8.08%. For me, food somewhat decreased and medical stayed mostly flat. 

Hourly earnings have still not recover to pre-pandemic levels. Which is a nice way of saying wage inflation has not kept up with the CPI. Real Earnings

I over estimated inflation for October, so here is hoping I over shoot in November. Range of 7.6%~7.9%. Sure things are moderating, but can we count on further reductions in Electricity, Utility (piped) gas service, apparel, Used cars and trucks, and Medical Care services? 

Am I an optimist, pessimist, or realist?


Thursday, October 13, 2022

Breakdown of the CPI DATA and Real Earnings reports for September 2022

It is that time of month, to survey the damage from inflation. The BLS report was released this morning and it was a surprise. (historical releases)

This is what I projected for the month...

For next month's projection, another wide range... 7-8%~8.3%, with month to month of -0.1~ up to 0.3%. The drop in gasoline failed to cover all the other areas, and the drop in gasoline for September will be much smaller, in my opinion.

Hmm... 

The Consumer Price Index for All Urban Consumers (CPI-U) rose 0.4 percent in September on a seasonally adjusted basis after rising 0.1 percent in August, the U.S. Bureau of Labor Statistics reported today. Over the last 12 months, the all items index increased 8.2 percent before seasonal adjustment.
Click to Enlarge
My own personal CPI was 8.1% year over year and up 0.3% from last month.

Click to Enlarge
The C.O.L.A. for 2023 is set at 8.7%...

Click to Enlarge
Last month I had stated the likelihood of 8.7%, but then got antsy an edged up the forecast to 8.8%. I really did not anticipate the CPI-W would underperform, compared to the CPI-U. That string since the start of covid has apparently ended. In any case, it almost was 8.8%, as pushing out a couple of digits was 8.746%. That 291.854 was just off the 291.879 to edge it to 8.750% and rounding to 8.8%. 

That was me trying to justify my errors. Close only counts in horseshoes and hand grenades. 

As for the Real Earnings ...
Click to Enlarge
 
Click to Enlarge
It still has not gotten back to pre-covid purchasing power and slipped last month. Of course that is for hourly workers, while the earnings for production and non supervisory employees was actually up $.03 hourly, from pre-covid and $3.68 weekly. So, the working stiffs are healing faster.

Click to Enlarge

Click to Enlarge
Real earnings are already adjusted for inflation.

And an apples to apples comparison can also be made as unemployment now matches February 2020.
Click to Enlarge
We should remember Covid hit the lower wage earners the hardest, as they were originally deemed non-essential and sent home, thus distorting the hourly and weekly rate. The higher wage earners were able to "work from home" while masturbating on zoom calls, etc. Until they realized that some of those non essentials were actually a bit more essential than first thought.

In any case, a fair apples to apples is now compared to February 2020. At least that is my opinion.

Seemed like I was going to mention petroleum. Crude Oil inventory up nearly 10M barrels, with Gasoline up 2M barrels, and uh oh... distillates down 4.8M barrels. Natural Gas inventories are starting to gain ground as well.

Tomorrow is the retail report, which should be interesting.

Oh yeah... next month CPI at 8.1%~8.2%, with m/m of +0.8%.

Tuesday, September 13, 2022

Breakdown of CPI DATA and Real Earnings, August 2022

It is that time of month, to survey the damage from inflation. The BLS report was released this morning and it was a surprise. (historical releases)

This is what I projected for the month...

Now for next month's CPI-U, and here's hoping I am once again overshooting... month over month at 0.0%~0.2% and year to year of 8.3% to 8.5%. 

Well, it was... 

The Consumer Price Index for All Urban Consumers (CPI-U) rose 0.1 percent in August on a seasonally adjusted basis after being unchanged in July, the U.S. Bureau of Labor Statistics reported today. Over the last 12 months, the all items index increased 8.3 percent before seasonal adjustment. 

Gasoline fell much, much further than last month and failed to provide cover for all the other areas, which are inflating. 

Click to Enlarge
Unadjusted remains sort of flat. Meanwhile my personal inflation rate edged up to 7.9%, with a +0.26% month to month increase. 

Click to Enlarge
On to the C.O.L.A. ... The CPI-W slid -0.2% for the month, which essentially narrowed the range for C.O.L.A. adjustments.
Click to Enlarge
Frankly speaking and after checking my pencil for an eraser... I'll pencil in 8.7% as the most likely C.O.L.A. The September CPI-W has a very wide range, as can be seen. Either side of the 8.7% figure is also a rather wide range.

As for the Real Earnings...
Click to Enlarge
The hourly is edging up slightly, but still below February 2020 rate.
Click to Enlarge
The weekly level slipped this month (all inflation adjusted) and is still below the February 2020 level.

For next month's projection, another wide range... 7-8%~8.3%, with month to month of -0.1~ up to 0.3%. The drop in gasoline failed to cover all the other areas, and the drop in gasoline for September will be much smaller, in my opinion. 

I guess what I am saying is... there could easily be another upside surprise, when the September numbers come out. I sincerely hope not. It has nothing to do with stocks, Federal Reserve or Macro Economics. I am just a poor schmuck getting squeezed.

Wednesday, August 10, 2022

Breakdown of CPI DATA and Real Earnings, July 2022

It is that time of month, to survey the damage from inflation. The BLS report was released this morning and it was a surprise. (historical releases)

This is what I projected for the month...

So, I will project 0.3%~0.5% month to month and a reading of 8.9%~9.1%. I fervently hope I am over shooting, this time. 

I did overshoot, as well as many others. 

The Consumer Price Index for All Urban Consumers (CPI-U) was unchanged in July on a seasonally adjusted basis after rising 1.3 percent in June, the U.S. Bureau of Labor Statistics reported today. Over the last 12 months, the all items index increased 8.5 percent before seasonal adjustment.
My own personal CPI was up a bit, after all the checks, credit cards, etc. were accounted for...

My annual rate is 7.8%, which is better than the CPI-U and CPI-W. Which brings me to the C.O.L.A. 

As July is 1/3 of C.O.L.A., it is very important. The forecast took quite a hit, from last month...

It would probably be best to state the 8.6%~9.0% is the high range, with expectations of a slide from there. 

However, while the CPI-U inflation number of 8.5% seems like an improvement, the food section is worrying. The report avoided the "food at home" on annual basis of 13.1%, although it did mention the 1.3% month to month rise, which is the 7th consecutive month of 1.0% or higher. Chew on that!!

While it is noted that gasoline fell, electricity has now risen 15.2% y/y and 3rd consecutive m/m increases of over 1%, with July at 1.6%.

The Real Earnings report also came out this morning...
Hooray, an uptick away from the downward trend, and getting closer to real earnings of pre-Covid.
Weekly earnings mirrored the hourly earnings. Both are due to a flat month to month CPI report, which is better than the opposite. Is it the start of a trend?

Not a bad set of number, considering the expectation. 

Now for next month's CPI-U, and here's hoping I am once again overshooting... month over month at 0.0%~0.2% and year to year of 8.3% to 8.5%. 

While gasoline is expected to have similar drops, relative to July's numbers... they are currently nearing their floor. The rest of the energy section will continue to rise, and likely food at home. This ain't over.

Even the 16% Trimmed Mean and the Median says it ain't over. Tomorrow's PPI might provide a hint.


Friday, April 29, 2022

End of the Month... March 2022 PCE, Advance GDP, and Other Stuff.

With the PCE index report this morning, we can wrap up all the March inflation numbers. Granted, some slight improvement was seen in some areas, but still double digit increases on the upstream models seem to suggest more inflation to the consumer.

As mentioned last month, the core seems to be decelerating and the potential for further decreases appear on the horizon. A lot depends on China's current covid lockdowns and impact on the supply chain.

We also see the personal income and outlays for March. Note the current dollars and chained dollars. Chained dollars are only used in a couple of categories. So thrown in inflation and the numbers aren't exactly rosy.

Yesterday the GDP Advance 2022 1st quarter was released and failed to live up to expectations. Quite a bit was made about Consumers still lifting the economy and the trade gap really stifling the numbers. As for the consumers, the bulk of that lift was in the service sector as the goods sector was flat. The Services was up 1.0% quarter to quarter and the trade gap was down 1.4% quarter to quarter. Outside of those two, everything else was tepid, imo. Although Non-Residential Fixed Investment was 2.2% above previous quarter. 

One quarter does not a recession make, so the numbers could significantly change as more data becomes available. 

Of course, the books are now closing for March, and it is on to April numbers. So, the impact of China's covid shutdown policies will become evident real soon, the "official" impact won't begin to be known until June. 

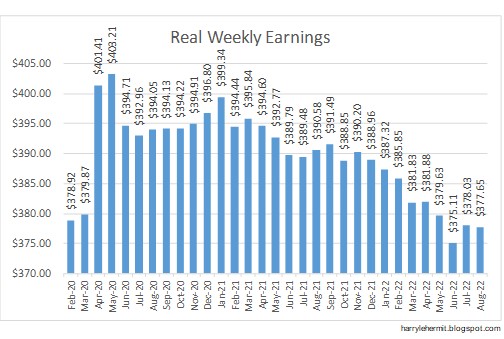
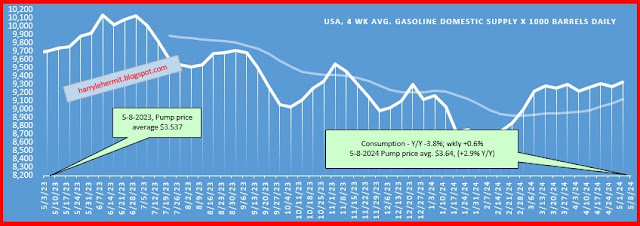
As for consumer inflation for April, I would tend to believe that energy would be flat from March. Don't be misled, as gasoline appears to be edging up at this writing as well as Natural Gas. Core inflation might be decelerating a bit, but food does not appear to be decelerating. Overall, the CPI should "cool" to near 8.0%. Welcome to the late 70s and early 80s of last century.

The U.S. should once again become a net exporter, for the year, of Petroleum and Petroleum Products over the next few weeks, as the exports have ballooned to nearly a 1-million-barrel net exports on a daily average. That million-barrel daily release from the SPR is slated to begin May 1st.

Oh well, this is "fun" times we live in!

Other Stuff...

It amazes me in this day and age... how utterly devoid of knowledge, we Americans have become. Although I can find numerous instances where we are not alone in knowledge deficit.

A near direct quote "Our politicians are always promising to fund infrastructure, yet here we are in 2022 and they have done nothing", which is greeted with broad agreement. Apparently we must all forget Congress passing a $1.4 Trillion infrastructure bill and the President signing it on November 15, 2021.

Usually during this conversation, someone will mention that Trillion Dollar shovel ready infrastructure bill signed by Obama in 2009... and ask what ever happened to that? It never existed. There was a $787 billion stimulus bill, which included about $98 billion for infrastructure, of which a portion was for shovel ready.

We have become equally adept at ignoring stuff that happens and making up stuff that didn't happen.

There really is no hope, so why bother? Everyone slows down to see a car crash or a train wreck or any number of other such things. 

Wednesday, January 12, 2022

Breakdown of CPI DATA and Real Earnings, December, 2021


The BLS report for December, Indicated a 7.0% yoy inflation rate with the month on month being 0.3% unadjusted of 0.5% after adjustments.

With this release comes a variety of other numbers...
I am at the 5.0% annual rate...
I had a better than expected outlook for my personal rate of inflation, but this continues to be due to medical costs rising at a much slower rate than everything else, AND at a slower rate than in recent years. I just cannot be so optimistic as to call this a long term trend.


The likelihood of January's numbers falling between 7.04% and 7.40% are fairly high at this point. While there was joy in the easing of energy prices, not sure the rough patch of weather in the next 2 weeks will not negate some of that joy. For comparison... June 1982 was 7.06% and then February 1982 was 7.62% and January 1982 at 8.39%. I throw that out as we heard highest inflation in nearly 40 years for last month and again for this month. Also, for the record, that 7.62% (2-1982) was the lowest rate since June of 1978.  

Also, beef prices are easing a bit, but Covid may mess up the work force in that category. In any case, the month to month changes will be the real guide going forward, as YOY increases might start to ease. Not that inflation is easing, but January 2021 saw inflation percolating and then lifting off in February. 

Historically, the June 1982 YOY inflation was pegged at 7.06%, compared to last months 7.04%. From there it is February 1982's 7.62%. Next month's headline will be highest inflation in nearly 40 years.

On to Real Earnings...

Basically the report indicates wages are keeping up with inflation on month to month, but still below the recent peak of September.


Friday, October 8, 2021

Saving Social Security and Changing C.O.L.A.


via GIPHY

I have been reading about attempts to save Social Security of which I partake. Does Social Security need saving?

The short answer is no, as social security will not come to an end in 2033/34. Think of the S.S. trust as a bank account. You put money into the bank and the bank uses it to make loans, which is how the bank can afford to pay interest into your account. That is the basic foundation of S.S. from the beginning in 1935.

The issue is... your expenses are now exceeding the amount you are putting into that bank account as well as the interest being paid to that account by the bank.

At some point in 2033/34, the amount being withdrawn cannot exceed the deposits, which results in something like 80% of withdrawals compared to previous.

The ideas being put forth, while ignoring the likelihood of congress doing anything...

A. Raise the eligibility ages. Considering the longevity of the average American is now older... probably an good idea, but not a complete resolution. 

B. Remove the cap on taxable earnings or raise it substantially. Probably the best solution across the board and can take various forms to alleviate the issue going forward. Whether deducting only from the worker and continuing cap on employers, etc.

C. Change the method for calculating increases. This runs into changing from current Consumer Price Index for Urban Wage Earners and Clerical Workers (CPI-W) to either Consumer Price Index for All Urban Consumers (CPI-U, which is current headline used) or Chained Consumer Price Index for All Urban Consumers (C-CPI-U) or Research CPI Experimental for Americans age 62 years of age and older (R-CPI-E). 

As an elder, I can narrow down the choice fairly quickly, based on which would have benefited me. The current method of CPI-W had fairly consistently moved with CPI-U and outpaced C-CPI-U on a historical basis. It does strike me as odd that the current CPI-W year over year is outpacing those two by a large margin. 

Historically, the following is based on typical rank of inflation (from highest inflation to lowest, based on August BLS release)...

  • R-CPI-E (100=1982; current 297.114 (217.8=2007, 36.42% increase since 2007)
  • CPI-W (100=1982; current 268.387)(205.777=2007, 30.42% increase since 2007)
  • CPI-U (100=1982; current 273.567 (210.236=2007, 30.12% increase since 2007)
  • C-CPI-U (121.295=2007: current 153.715) (26.73% increase since 2007)

    Based on data from August BLS release...

    • CPI-W (5.8%)
    • CPI-U (5.3%)
    • C-CPI-U (5.1%)
    • R-CPI-E (4.8%)
    So obviously for the long haul, I would have preferred the R-CPI-E, based on the above, but... since December 2016 until July 2021, the changes have been this by rank... (did not update to August numbers.)
    • CPI-W: 13.8%
    • CPI-U: 13.1%
    • R-CPI-E: 12.86%
    • C-CPI-U: 11.68%
    Clearly something has changed since 2016 and the near term data favors the CPI-W. 

    Until something better comes along, the CPI-W remains the best option as the E in R-CPI-E stands for experimental. Not sure why so many on the left are pushing the R-CPI-E. I understand the right's fascination with C-CPI-U.

    The answer to the Social Security dilemma is a combination of A and B. While it is a fun task for me to opinionize about the matter, it still falls to a future congress to actually do something.

    Congress does not move on major projects unless pushed into a corner. My guess would be about 10 years from now... that corner will come into view. Truly, I do hope to be around to see that take place.


    This Week in Petroleum Summary May 8th, 2024 per EIA.GOV

    This week's  full report . Gasoline fell -2.3¢ for the week, but remains +10.3¢ from year ago level. Consumption did edge up this past r...