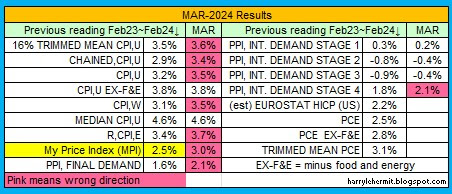
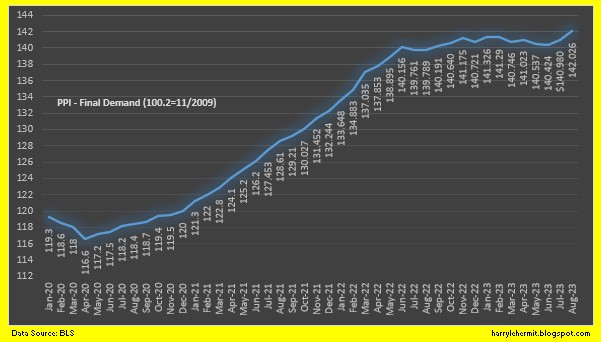
Showing posts with label ppi. Show all posts

Thursday, April 11, 2024

PPI APR. 2024 release March 2024 Data

The BLS has released the March, 2024 Producer Price Index Report (historical releases)

The Producer Price Index for final demand rose 0.2 percent in March, seasonally adjusted, the U.S. Bureau of Labor Statistics reported today. Final demand prices moved up 0.6 percent in February and 0.4 percent in January. (See table A.) On an unadjusted basis, the index for final demand increased 2.1 percent for the 12 months ended in March, the largest advance since rising 2.3 percent for the 12 months ended April 2023.

The March increase in the index for final demand is attributable to a 0.3-percent rise in prices for final demand services. In contrast, the index for final demand goods edged down 0.1 percent.

The index for final demand less foods, energy, and trade services moved up 0.2 percent in March after rising 0.3 percent in February. For the 12 months ended in March, prices for final demand less foods, energy, and trade services increased 2.8 percent.

Now for a graph and chart...


As stated, the 2.1% is the highest final demand number since April 2023. There seems to be some quibbling over that number, as related to gasoline prices. I should point out the "preliminary" tag on many items. So we can expect some more adjustments in those months.

I have read where the final demand would have been 2.4%, had the gasoline been correctly attributed. I don't think the annual would have seen that. However, the monthly figure is indeed laughable, and should have been near last month's figure.. 

The final demand is creeping up, which is troubling. Even more troubling is the final demand for food, which popped a healthy +0.8% on the month, which follows +1.1% for the previous month. Chew on that for awhile.


Thursday, March 14, 2024

PPI Mar. 2024 release February 2024 Data

The BLS has released the February, 2024 Producer Price Index Report (historical releases)

The Producer Price Index for final demand rose 0.6 percent in February, seasonally adjusted, the U.S. Bureau of Labor Statistics reported today. Final demand prices increased 0.3 percent in January and edged down 0.1 percent in December 2023. (See table A.) On an unadjusted basis, the final demand index advanced 1.6 percent for the 12 months ended in February, the largest rise since moving up 1.8 percent for the 12 months ended September 2023.

In February, nearly two-thirds of the rise in final demand prices can be traced to the index for final demand goods, which advanced 1.2 percent. Prices for final demand services moved up 0.3 percent.

The index for final demand less foods, energy, and trade services increased 0.4 percent in February after rising 0.6 percent in January. For the 12 months ended in February, prices for final demand less foods, energy, and trade services moved up 2.8 percent.

Current graph with revisions...

Then there is this chart, which briefly compares the category to previous month's annual rate.


So the report was deemed as troubling, as it will be passed on to the consumer. No doubt inflation is not down to the level sought, but not a rapid acceleration. More of tepid acceleration in my opinion.


Friday, February 16, 2024

PPI Feb. 2024 release January 2024 Data

The BLS has released the January, 2024 Producer Price Index Report (historical releases) 

Final demand services: The index for final demand services moved up 0.6 percent in January, the largest increase since rising 0.8 percent in July 2023. In January, most of the advance is attributable to prices for final demand services less trade, transportation, and warehousing, which climbed 0.8 percent. The index for final demand trade services moved up 0.2 percent. (Trade indexes measure changes in margins received by wholesalers and retailers.) Conversely, prices for final demand transportation and warehousing services fell 0.4 percent. 

Product detail: A 2.2-percent increase in the index for hospital outpatient care was a major factor in the January rise in prices for final demand services. The indexes for chemicals and allied products wholesaling, machinery and equipment wholesaling, portfolio management, traveler accommodation services, and legal services also moved higher. In contrast, prices for long-distance motor carrying decreased 1.0 percent. The indexes for computer hardware, software, and supplies retailing and for engineering services also moved lower. (See table 2.)

I emphasized a specfic portion. after much jockeying with revisions of numbers in the medical category over the past year... those have come to and end. So after all these revision helped tamp down inflation numbers, those days are over.


The headlines have focused on how the PPI report came in hotter than expected. I wonder if the expectations are real or some hope of immediate relief in those interest rates. It is coming, just not tomorrow. 

Friday, January 12, 2024

Producer Price Index January release December 2023 Data

The BLS has released the December Producer Price Index Report (historical releases)

The Producer Price Index for final demand fell 0.1 percent in December, seasonally adjusted, the U.S. Bureau of Labor Statistics reported today. Final demand prices moved down 0.1 percent in November and 0.4 percent in October. (See table A.) On an unadjusted basis, the index for final demand rose 1.0 percent in 2023 after increasing 6.4 percent in 2022.

If the PPI is really a forerunner of consumer inflation, then CPI should continue to ease, as PPI has nearing same rate as CPI in the periods outlined below.


I would hope the drops in food and energy will continue, or at least stabilize. I suspect energy will creep up in the coming months, as this is a seasonal lull, according to previous December reports. Those same reports suggest a seasonal lull for foods.

I guess it is important to find the good news and celebrate... however fleeting it might be.

Wednesday, December 13, 2023

Producer Price Index December release November 2023 Data

The BLS has released the November Producer Price Index Report (historical releases)

The Producer Price Index for final demand was unchanged in November, seasonally adjusted, the U.S. Bureau of Labor Statistics reported today. Final demand prices decreased 0.4 percent in October and rose 0.4 percent in September. (See table A.) On an unadjusted basis, the index for final demand increased 0.9 percent for the 12 months ended in November.

In November, the indexes for both final demand goods and for final demand services were unchanged. 


Final demand goods: The index for final demand goods was unchanged in November after dropping 1.4 percent in October. In November, price increases of 0.6 percent for final demand foods and 0.2 percent for final demand goods less foods and energy offset a 1.2-percent decrease in the index for final demand energy.

Let's revisit that paragraph. What did the -1.2% decrease in the index for final demand energy... offset?

Within final demand goods in November, prices for chicken eggs jumped 58.8 percent. The indexes for fresh fruits and melons, utility natural gas, electric power, and carbon steel scrap also moved higher. In contrast, prices for gasoline fell 4.1 percent.

So gasoline (-4.1%), which is typically moving into seasonal lows, is the reason for that -1.2% decrease, which offsets a bunch of rises in food (+0.6%) and other energy components. 

Not to nitpick, but if gasoline is having that impact, and is moving into seasonal lows, which might continue through the December release... could reverse beginning after Christmas, just like last year.

For those of us that like to eat food, that annualized 7.2% increase in food is going to weigh on the budget of many of us, unless we decide to eat less and lose "weight".

Wednesday, October 11, 2023

Producer Price Index October release with September 2023 Data

The BLS has released the September Producer Price Index Report (historical releases) 

The Producer Price Index for final demand increased 0.5 percent in September, seasonally adjusted, the U.S. Bureau of Labor Statistics reported today. Final demand prices rose 0.7 percent in August and 0.6 percent in July. (See table A.) On an unadjusted basis, the index for final demand advanced 2.2 percent for the 12 months ended in September, the largest increase since moving up 2.3 percent for the 12 months ended in April. 

Leading the increase in the final demand index in September, prices for final demand goods rose 0.9 percent. The index for final demand services advanced 0.3 percent.

Prices for final demand less foods, energy, and trade services increased 0.2 percent in September, the fourth consecutive advance. For the 12 months ended in September, the index for final demand less foods, energy, and trade services moved up 2.8 percent.


As is often the case... there were revisions to previous month's data, so don't be surprised if this month's data is revised next month. The size of July's data was a bit surprising however. When that data came out, it was considered above expectations at +0.3%. A couple of month's later, it was revised to +0.6%, without any discussion.


In any case, I will continue to track, but this should wrap up publishing my thoughts.


Thursday, September 14, 2023

Producer Price Index September release with August 2023 Data

The BLS has released the July Producer Price Index Report (historical releases) 

The Producer Price Index for final demand increased 0.7 percent in August, seasonally adjusted, after rising 0.4 percent in July, the U.S. Bureau of Labor Statistics reported today. (See table A.) The August advance is the largest increase in final demand prices since moving up 0.9 percent in June 2022. On an unadjusted basis, the index for final demand rose 1.6 percent for the 12 months ended in August.

In August, 80 percent of the rise in final demand prices is attributable to a 2.0-percent jump in the index for final demand goods. Prices for final demand services advanced 0.2 percent.

The index for final demand less foods, energy, and trade services increased 0.3 percent in August, the same as in July. For the 12 months ended in August, prices for final demand less foods, energy, and trade services rose 3.0 percent, the largest advance since moving up 3.4 percent for the 12 months ended in April.


So, the story is about gasoline prices creating most of the PPI. This might be true, but the current forecast is up and not down for that commodity.


Everything is screaming some future relief, except for what drove the August PPI higher. September is shaping up as a repeat of August, imho.


Not the most scientific metric, but there is more pink than last month. Not saying inflation is about to accelerate, but not so sure that crude oil will taper off its current rise. And we should remember that yesterday's CPI report mentioned the impact of gasoline, but also indicated that energy prices were down compared to one year ago... current at 294.328, year ago at 305.372. Gasoline current... 336.979, year ago at 348.593.

So, if last month's PPI was impacted by energy and thereby distorting the number, then energy being cheaper this year than last... would indicate the YoY 1.6% is also distorted. In fact the release indicates the PPI excluding energy was 2.0%. 

That is not a bad number, imho. Things are indeed looking up... except for pump prices, which are also looking up, but not in a good way.

Friday, August 11, 2023

Producer Price Index August 2023 release

The BLS has released the July Producer Price Index Report (historical releases) 

The Producer Price Index for final demand increased 0.3 percent in July, seasonally adjusted, the U.S. Bureau of Labor Statistics reported today. Final demand prices were unchanged in June and declined 0.3 percent in May. (See table A.) On an unadjusted basis, the index for final demand advanced 0.8 percent for the 12 months ended in July. 

In July, the increase in final demand prices was led by a 0.5-percent rise in the index for final demand services. Prices for final demand goods edged up 0.1 percent.

The rate of increases has somewhat slowed and selected areas are now trending downward. The PPI since start of Covid has risen 17.3%, compared to the CPI rise of 19.2%. (That is just two data points and should not be construed as any indication of some guaranteed future changes.)

Certainly improvement, but overall a "D" rating as for inflation outlook, imho. August would appear to have a further inflation uptick, from July's reports. 


Thursday, July 13, 2023

Producer Price Index July 2023 release for June Data.

The BLS has released the June Producer Price Index Report (historical releases) 

The Producer Price Index for final demand increased 0.1 percent in June, seasonally adjusted, the U.S. Bureau of Labor Statistics reported today. Final demand prices declined 0.4 percent in May and edged up 0.1 percent in April. (See table A.) On an unadjusted basis, the index for final demand advanced 0.1 percent for the 12 months ended in June. 

In June, the increase in final demand prices can be traced to a 0.2-percent rise in the index for final demand services. Prices for final demand goods were unchanged.

The index for final demand less foods, energy, and trade services moved up 0.1 percent in June after no change in May. For the 12 months ended in June, prices for final demand less foods, energy, and trade services advanced 2.6 percent.


The rate of increases has slowed and selected areas are now trending downward. The PPI since start of Covid has risen 17.8%, compared to the CPI rise of 18.3%. (That is just two data points and should not be construed as any indication of some guaranteed future changes.)

The downward trend continues...

Except...

The attention is now shifting to "services"..

Even this will likely resume falling by next month, as it is an annual rate. The montly stood flat, after two months of gains.

Still, a good report... IF the trend continues.

Wednesday, June 14, 2023

Producer Price Index June 2023 release for May Data.

The BLS has released the April Producer Price Index Report (historical releases)

The Producer Price Index for final demand declined 0.3 percent in May, seasonally adjusted, the U.S. Bureau of Labor Statistics reported today. Final demand prices rose 0.2 percent in April and fell 0.4 percent in March. On an unadjusted basis, the index for final demand moved up 1.1 percent for the 12 months ended in May.

In May, the decline in the final demand index can be traced to prices for final demand goods, which fell 1.6 percent. The index for final demand services increased 0.2 percent. 

Prices for final demand less foods, energy, and trade services were unchanged in May after inching up 0.1 percent in April. For the 12 months ended in May, the index for final demand less foods, energy, and trade services increased 2.8 percent. 

Overall, the trend is downward and some relief might be in sight for the consumer.

The decreased costs in unprocessed intermediate, have not completely moved into the processed area. Possibly by next month? 
Unprocessed goods for intermediate demand: The index for unprocessed goods for intermediate demand fell 4.8 percent in May after increasing 1.6 percent in April. Almost 60 percent of the broad- based decrease is attributable to a 7.8-percent drop in prices for unprocessed energy materials
Nearly 60 percent of the May decline in the index for unprocessed goods for 
intermediate demand can be traced to prices for crude petroleum, which fell 10.2 percent.
The price drops all across the petroleum sector are evident in the report. Another big drop should be forthcoming in the report for June, as this sector peaked last June. 

After that, the impact of petroleum will decrease and the focus will shift elsewhere. As the saying goes... the low hanging fruit will have been picked by fall. 

When looking at the overall, as in the first graph and seeing it hold relatively steady, then realizing the significant drops in energy... sticky it is.

Thursday, May 11, 2023

Producer Price Index May 2023 release for April Data.

The BLS has released the April Producer Price Index Report (historical releases)

The Producer Price Index for final demand advanced 0.2 percent in April, seasonally adjusted, the U.S. Bureau of Labor Statistics reported today. Final demand prices fell 0.4 percent in March and were unchanged in February. On an unadjusted basis, the index for final demand moved up 2.3 percent for the 12 months ended in April. 

In April, 80 percent of the rise in the index for final demand is attributable to a 0.3-percent increase in prices for final demand services. The index for final demand goods advanced 0.2 percent.

Prices for final demand less foods, energy, and trade services rose 0.2 percent in April after inching up 0.1 percent in March. For the 12 months ended in April, the index for final demand less foods, energy, and trade services increased 3.4 percent.

Certainly, the PPI increases have slowed, but not sure all has been reflected in the CPI. Historically, the CPI is has risen slightly faster that PPI, yet the past 3 years has seen the PPI outdistance the CPI. This is reflected in the following graph.

The chart indicates the comparison of that 39 month period, compared to the preceding 109 months.

Reverting to normal requires a negative PPI and/or continued inflation for the next few months. 

It will take most of the year, before normal takes places, imho. 

Friday, April 29, 2022

End of the Month... March 2022 PCE, Advance GDP, and Other Stuff.

With the PCE index report this morning, we can wrap up all the March inflation numbers. Granted, some slight improvement was seen in some areas, but still double digit increases on the upstream models seem to suggest more inflation to the consumer.

As mentioned last month, the core seems to be decelerating and the potential for further decreases appear on the horizon. A lot depends on China's current covid lockdowns and impact on the supply chain.

We also see the personal income and outlays for March. Note the current dollars and chained dollars. Chained dollars are only used in a couple of categories. So thrown in inflation and the numbers aren't exactly rosy.

Yesterday the GDP Advance 2022 1st quarter was released and failed to live up to expectations. Quite a bit was made about Consumers still lifting the economy and the trade gap really stifling the numbers. As for the consumers, the bulk of that lift was in the service sector as the goods sector was flat. The Services was up 1.0% quarter to quarter and the trade gap was down 1.4% quarter to quarter. Outside of those two, everything else was tepid, imo. Although Non-Residential Fixed Investment was 2.2% above previous quarter. 

One quarter does not a recession make, so the numbers could significantly change as more data becomes available. 

Of course, the books are now closing for March, and it is on to April numbers. So, the impact of China's covid shutdown policies will become evident real soon, the "official" impact won't begin to be known until June. 

As for consumer inflation for April, I would tend to believe that energy would be flat from March. Don't be misled, as gasoline appears to be edging up at this writing as well as Natural Gas. Core inflation might be decelerating a bit, but food does not appear to be decelerating. Overall, the CPI should "cool" to near 8.0%. Welcome to the late 70s and early 80s of last century.

The U.S. should once again become a net exporter, for the year, of Petroleum and Petroleum Products over the next few weeks, as the exports have ballooned to nearly a 1-million-barrel net exports on a daily average. That million-barrel daily release from the SPR is slated to begin May 1st.

Oh well, this is "fun" times we live in!

Other Stuff...

It amazes me in this day and age... how utterly devoid of knowledge, we Americans have become. Although I can find numerous instances where we are not alone in knowledge deficit.

A near direct quote "Our politicians are always promising to fund infrastructure, yet here we are in 2022 and they have done nothing", which is greeted with broad agreement. Apparently we must all forget Congress passing a $1.4 Trillion infrastructure bill and the President signing it on November 15, 2021.

Usually during this conversation, someone will mention that Trillion Dollar shovel ready infrastructure bill signed by Obama in 2009... and ask what ever happened to that? It never existed. There was a $787 billion stimulus bill, which included about $98 billion for infrastructure, of which a portion was for shovel ready.

We have become equally adept at ignoring stuff that happens and making up stuff that didn't happen.

There really is no hope, so why bother? Everyone slows down to see a car crash or a train wreck or any number of other such things. 

Thursday, March 31, 2022

End of the Month... So February 2022 Inflation Numbers and Other Stuff.


With the PCE index report this morning, we can wrap up all the February inflation numbers. Granted, some slight improvement was seen in some areas, but still double digit increases on the upstream models seem to suggest more inflation to the consumer.

There does seem to be some potential for deceleration in core inflation, as decreased purchasing power is becoming more widespread. Inventories of retail and wholesale have increase ahead of inflation. Normally this could be seen as wonderful news, but it is hard to keep a straight face over lingering claims of supply chain shortages and increases in inventories, in my opinion. 

We all know that supply v demand is the determinant of pricing. If demand goes up and supply can't keep up... prices increase. Demand falls and supply increases... prices decrease. The past year saw demand pumped up with various stimulus checks and which contributed to "supply chain" issues. The benefit of that additional money is waning as retail sales minus inflation are flat to lower. Even more so with energy and food pulled from the equation.

As stated, core items might fall in the coming months, but what about energy and food?

Energy is struggling to supply to meet the demand. Regardless of any Strategic Petroleum Reserve activity... the demand will need to decrease for price relief. Going into the summer driving season, I am not so sure that will take place before August. Besides, that 1-million-barrel daily release will likely be exported, which may have impact on global prices, which may in turn trickle down to the US Consumer... eventually. We must remember the previous release announced last fall has not yet been completed. The 30 Million barrel release announced in March has not started, so just how quick will this happen?

Maybe in time for the midterms, but then you have the other headline issue...

Food, which accounts for about 14% of the Average American expense, compared to 8% for energy (>4% for Gasoline). Food is the one item that rarely sees a decline in demand and usually an increase as the global population is still growing. It really is all about supply and weather impacts of the past couple of years has NOT been conducive to slowing food price inflation. Throw in the Ukraine invasion and this is not an area that will likely seen any leveling off unless we get a good global weather pattern for crops and peace breaks out quick in war torn areas. 

Food is likely to be the issue for the next couple of years. A case could be made that Russia invaded Ukraine to control its large agriculture industry, to which it could use as influence amongst its friends, etc. Whatever the reason, it has clearly backfired, and the global community will become increasingly unsettled over food insecurity.

We will likely see the CPI in the mid 8% range in March's report and higher the following month. Much will be made about the high price of gasoline, but the food component is the real long-term story.

Forget the Oscars, as inflation is about to give us all a slap in the face. 

Friday, February 25, 2022

Near End of the Month, So January 2022 Inflation Numbers and Other Stuff.


ALL the inflation numbers are in and they are pointing upward, with the exception of PPI, which was flat. But the leading indicators of PPI are still in double digits. 

Quite a bit of chatter regarding energy prices and how they will ramp up inflation. There is no denying that, but every single number that excludes food and energy is up as well. Don't be misled by headlines screaming energy costs are going to cause double digit inflation. 

We might very well see double digit inflation, but if everything stays flat and energy were to drive up the overall inflation... then crude would need to be in the $180 @ bbl. We will be in recession, well before that occurs. Energy is a part of inflation, but not the entire story. Attempting to backward blame inflation on solely energy and current geo-politics, is to ignore the inflation prior to these events.

Those inflation factors are still prevalent and really no let up going forward the next couple of months. Previously the inflation was anticipated to peak in February (numbers due out in March), but those energy related and geo-political issues might edge up succeeding months. We were in the May/June timeframe of any year over year relief... which is prior to certain current events.

There is talk of the FED backing off rate hikes but maybe a bit premature. Granted the FED is looking for any excuse to avoid lifting rates, but they are behind the curve, so will raise rates, to make room for lowering them later on. 

As for Ukraine... they are not a member of the EU or of NATO, but a member of the UN. 30+ years ago, Iraq invaded Kuwait, which was also a member of the UN. A coalition was quickly and rapidly formed to kick Iraq out. Kuwait had oil, Ukraine not so much. 

Not sure how this thing will turn out, but it will soon become old news and everyone will move on. That is the sad state of things. There will be a period of media pictures and videos of bombs exploding, missiles being launched, but then this will become boring and no longer a driver of news ratings. 

Not unlike Covid, which still has a high death rate, but somehow is cured... at least to the extent it does not make more than a ripple in the news. Everyone is racing to get back to normal, which means accepting certain unpleasant facts. 

Currently the forecast for February CPI numbers (Due out in March 10th) stands in the range of 7.63% to 7.9%. 7.62% was the annual rate in February 1982. January 1982 was 8.39%.


Tuesday, February 15, 2022

Producer Price Index for January 2022


The Producer Price Index for final demand increased 1.0 percent in January, seasonally adjusted, the U.S. Bureau of Labor Statistics reported today. This rise followed advances of 0.4 percent in December 2021 and 0.9 percent in November. On an unadjusted basis, final demand prices moved up 9.7 percent for the 12 months ended January 2022. 
In January, the index for final demand services rose 0.7 percent, and prices for final demand goods moved up 1.3 percent.


Again, an ever so slight deceleration in upstream stages. (note the Eurostat for US is my estimate as the actual info has not been published).

The retail report tomorrow, while also backward looking, could provide some indication of future activity.

Just read an article that said $115 per barrel of oil could drive inflation to 10%. My calculations indicate a figure nearer to 8.4%, which leaves the over 92% of the remaining to increase above that rate. Let's not fixate on just one part of the consumer purchasing basket, imo.

Friday, January 28, 2022

Near End of the Month, So December 2021 Inflation Numbers and Other Stuff.


It's all the inflation numbers in one chart. As always, the MPI is most important to me, as it is what I spend.

The forecast across the board for January is upward... except maybe for the PPI. It's hard to imagine consumer spending slipping, inventories jumping and orders lagging... resulting in anything other than a deceleration of the PPI. But the experts seem to think May is when things will start to decelerate for all the above. In fact the PPI is forecast to reverse in May, back to 5 months ago range, which will somewhat stagnate the monthly CPI... not a reversal.  

BUT... a bit of history. Last year, there was consensus on helicopter money directly to the masses. Our leaders wanted it to jump start the economy and the FED said do it, we've got your back. The the term transitory became a popular word... until it was decided it might no longer be applicable to the current situation. 

So the FED is fixing to do something and the knives are out. Who knows what will happen?

Unfortunately for a lot of Americans on fixed income, it will not help, as the die is already cast. A fixed income limits any increases in spending and reduces the amount purchased. The alternative would be adding debt, which would now be costlier, if the rates are raised. It is a never ending cycle, imo.

Enough of the depressing news. I'll go watch some YouTube comedians or take a nap... or both.

Thursday, January 13, 2022

Producer Price Index for December 2021


The Producer Price Index as released by the BLS, this A.M. 

The Producer Price Index for final demand increased 0.2 percent in December, seasonally adjusted, the U.S. Bureau of Labor Statistics reported today. This rise followed advances of 1.0 percent in November and 0.6 percent in October. On an unadjusted basis, final demand prices moved up 9.7 percent in 2021, the largest calendar-year increase since data were first calculated in 2010. 

In December, the advance in the final demand index can be traced to a 0.5-percent increase in prices for final demand services. Conversely, the index for final demand goods decreased 0.4 percent. 

An ever so slight easing, imo, for the upstream inflation. As always, this is backward looking data and does not forecast what might happen in the future. 

The retail report tomorrow, while also backward looking, could provide some indication of future activity.

Tuesday, December 14, 2021

Producer Price Index for November 2021


The Producer Price Index for final demand increased 0.8 percent in November, seasonally adjusted, the U.S. Bureau of Labor Statistics reported today. Final demand prices moved up 0.6 percent in each of the 3 prior months. (See table A.) On an unadjusted basis, the final demand index rose 9.6 percent for the 12 months ended in November, the largest advance since 12-month data were first calculated in November 2010.

In November, the index for final demand services rose 0.7 percent and prices for final demand goods increased 1.2 percent.

Clearly not good, looking forwards. The Final Demand is higher than previous month, as is the intermediates. It would appear that a lot of inflation is to be passed on to the eventual consumer. There appears to be limited hope of annual inflation falling below 3% before next summer, based on these numbers. 

It should be noted that this is all in the review mirror as will be tomorrow's  Retail numbers. Those retail numbers, however... could provide a clue going forward.

Wednesday, November 10, 2021

CPI for October, 2021


Holy Toledo!!! And other places as well. The CPI-U came in at a staggering 6.2% YOY, well above anybody's expectations. Although given yesterday's PPI, the expectations should have been revised upward. 

There were no hints of slowdown in nearly any category, with maybe the medical category, which has been rather benign over the past 12 months. I cannot accept that as being a long term trend, no matter how much I wish it were true. 

Even my own personal household cpi rate, woke me up. While not in the same impact as the CPI-U, it was 

4.16%, with the monthly increase similar to the CPI-U.

Realistically, my being under the CPI-U is largely due to hoarding prior to the referenced timeframe and subsequent easing of quantities. Seriously, there are only so many cans of pork and beans that a person can eat in a lifetime. (Unlike the annual revision of various weighting of items, I revise monthly.)

The Real Earnings report was also released. While it is oft cited that wage increases are inflationary, it should be pointed out that current wage increases are a result of previous inflation.
Real Hourly earnings based in 1982~1984 dollars, fell this past month, as did a dip in hours worked, which translates into even steeper weekly earnings drop. 

With both Producer prices at the final and intermediate demand levels still rising, it is hard to foresee any glimpse of peaking anytime soon. Then there is the importation of inflation. We are a net importer and inflation is ramping up among our trading partners. 

Most notably would be China, where producer price inflation is north of 10%, but where the Government is forcing producers to hold the line to keep Chinese consumers in the 1% inflation range. 

How could these companies survive in such a climate? Cranking up prices well beyond 10% for foreign customers.  Some of that is likely a part of the intermediate demand increases, which are not tapering at this time. 

The forecast for November is 6.6%~6.9%. October was 6.2% compared to a 5.7%~5.9% expectation. For the record, 6.6% would be the highest since June, 1982.

Then there is some theoretical relief from the Federal Reserve, with an interest rate increase to slow inflation. The FED looks that the CORE inflation and not the core CPI-U from the BLS, but rather the Core of the PCE, from the BEA. 

The FED has frequently cited the need to establish this Core at 2%... over a period of time. Not real sure what the timeline would be, but the past 5 years has shown a 2.11% annual rise. Yet the thinking is the FED action will not happen until next summer. 

The problem is the FED is stuck between a rock and a hard place. When that theoretical raise occurs, the capital/financial markets could be damaged. 

In my opinion, the FED keeps talking up transitory, while hoping the consumer finally capitulates on spending due... to inflation. They can then claim they were right all along.

It is so difficult to remain optimistic. 


Tuesday, November 9, 2021

Producer Price Index for October 2021


The release of October's report on the Producer Prices took place this AM.

The Producer Price Index for final demand increased 0.6 percent in October, seasonally adjusted, the U.S. Bureau of Labor Statistics reported today. Final demand prices moved up 0.5 percent in September and 0.7 percent in August. (See table A.) On an unadjusted basis, the final demand index rose 8.6 percent for the 12 months ended in October.

That's all and good, but there was a taste of hope (pun intended) in the food index, which was flat for the month to month (actually down -0.4%).  The indigestion comes from the realization the consumer price inflation has not kept up with the producer price inflation. So until consumer prices catch up, which could be combined with Producer Price final goods decrease (It is possible as indicated above), the next few monthly reports of CPI could be difficult.

The intermediate goods Producer Price section, indicates that all the increases have yet to be passed on to the final goods section, which is then passed on to the consumer. Oh Joy!! Upstream from that is a whole bunch of stuff that has yet to be passed on to that intermediate thingy.

The final demand costs of most everything else was on the rise, especially energy.

Up tomorrow will be the CPI and Real Earnings.


Review of March 2024 data, 1Q GDP, PCE and personal income

The monthly summary is not so wonderful, incomparison... Inside all that pink is some troubling food related issues. Even though energy is s...