Laugh of the week
Watching Sky News and a lady proclaimed that social media sites should be held to the same strict standards as newspaper publishers and television news sites. Clearly she meant the UK, but some of the craziest and insane misinformation has come to me via Sky News and UK newspapers.
Admittedly, the UK media is not as off the rails as American Media.
Greenland, what if...
If Greenland were to be independent, would it still be part of NATO? If not, why would we think they would align with the USA. China and/or Russia would run the bids up, imo. A strategic part of the world could be up for grabs.
Don't just laugh off the "Greenland" rhetoric, imho.
Climate Change
Accepting that the climate is definitely changing, why is all the focus all on the halt of bad emissions? If we were to suddenly halt these bad emissions, things will not return to normal the next day. In fact it would take many decades, if not hundreds of years.
During that period of time, the ice caps will continue to melt, the oceans will continue to rise and the storm patterns will persist. The state of Florida will likely be under water, much of New York City will be under water. So why aren't preparations being made NOW... for such events?
Which brings me to...
LA Fires
There has always been wild fires in California, yet climate change is now considered the root cause. Yet nothing is being done to prepare for what should be considered a certainty.
Blaming "climate change" is much easier than doing something, imho.
Cease Fire
I am typing this on Thursday, 1-16-2025. Call me skeptical, but this seems like a peace deal for Biden, that will fall apart immediately and the Democrats will attempt to blame it on Trump. It theoretically takes place on Sunday, the 19th, so I think shortly after noon on the 20th... things will fall apart.
Economic reports this week
A lot of pink, which indicates rising numbers, but not above expectations, imo.
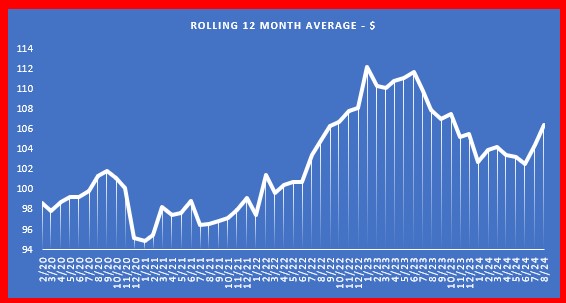
Also, the retail sales report clocked in with an inflation adjusted +1.0% over the preceding 12 months. The current inflation adjusted sales is the highest since January, 2023.
Energy
Pump prices will likely rise about a nickel over the next couple of weeks. Which matches the nickel rise over the past week.
That's it, this is getting boring.


