Showing posts with label real earnings. Show all posts

Wednesday, April 10, 2024

BLS Data Dump. CPI - April 10th, 2024

First up is the BLS Report for CPI...(historical releases)

The Consumer Price Index for All Urban Consumers (CPI-U) increased 0.4 percent in March on a seasonally adjusted basis, the same increase as in February, the U.S. Bureau of Labor Statistics reported today. Over the last 12 months, the all items index increased 3.5 percent before seasonal adjustment.

The index for shelter rose in March, as did the index for gasoline. Combined, these two indexes contributed over half of the monthly increase in the index for all items. The energy index rose 1.1 percent over the month. The food index rose 0.1 percent in March. The food at home index was unchanged, while the food away from home index rose 0.3 percent over the month.

Here is the unadjusted CPI for the past 12 months...

My own personal CPI rose 3.0% Y/Y and 0.6% on the month...

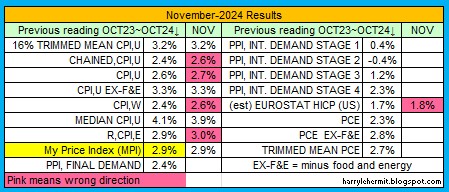
Taking a look at the report card...


Not real pretty, imho. It should be noted the release partially laid the surge in inflation at the feet of energy. True on a monthly basis, but Y/Y is up 2.1%, compared to the headline of 3.5%. Even food was at 2.2%, so start looking much harder within that CPI ex food and energy number of 3.8%.

Speaking of food...


Hidden in all those numbers and weightings... food away from home ease barely above January, 2021 numbers. That is NOT adjusted for inflation, but in current dollars. I can't help but think the entities making up the food away from home category... is struggling.  

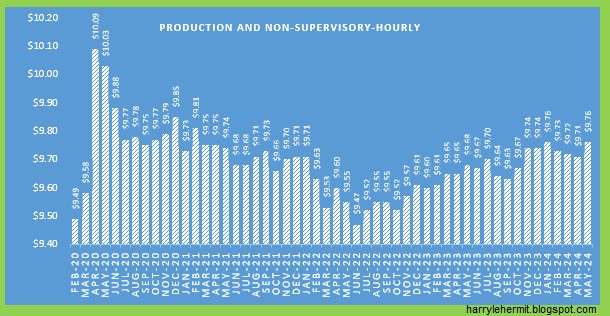
As for Real Earnings.

An increase of 4¢ from February, 2020. It is important to adhere to that timing, as it was before the disruption of the workforce, cue to covid.


The overall report does show some stagnation for wage growth. Hard to make anything uplifting from the data. 

Sorry!


Tuesday, March 12, 2024

BLS Data Dump. CPI - March 12th, 2024

First up is the BLS Report for CPI...(historical releases

The Consumer Price Index for All Urban Consumers (CPI-U) increased 0.4 percent in February on a seasonally adjusted basis, after rising 0.3 percent in January, the U.S. Bureau of Labor Statistics reported today. Over the last 12 months, the all items index increased 3.2 percent before seasonal adjustment.

The index for shelter rose in February, as did the index for gasoline. Combined, these two indexes contributed over sixty percent of the monthly increase in the index for all items. The energy index rose 2.3 percent over the month, as all of its component indexes increased. The food index was unchanged in February, as was the food at home index. The food away from home index rose 0.1 percent over the month.

While the chart below shows the past 12 months, it should be noted the end of 2022 also saw a downward trend, prior to 2023 rises. The February number continues the 2023 1st quarter upward swing.

On the other hand, my own personal CPI rate has continued upward, albeit not as high as the CPI-U.

That is 2.5% annual, with another sharp 0.4% increase for February. The reason last month was the medical category, but is more evenly spread for this month. My worse fear being that my personal rate is edging up towards the CPI-U rate, which seems mired in a narrow range.

The R-CPI-E did ease from last month's annual of 3.5% to this month's annual of 3.4%. The month to month was still at +0.6%, but is more of a rounding issue. Last month was +0.635% and this month at +0.554%.

Across the board resulted in this picture...

As for Real Earnings.

Not such a good report, as indicated by this graph...

While the downward spike of 3¢ per hour might not seem large, it follows downward revisions in two previous months. Revisions are a normal part of the process, but a troubling trend is frequency of downward revisions in previous month's data. This tends to enhance the belief of manipulation in an election year.

This follows the pattern of jobs, GDP, etc. Not a real confidence builder, imo.


Tuesday, February 13, 2024

BLS Data Dump. CPI - February 13, 2024

First up is the BLS Report for CPI...(historical releases)

The Consumer Price Index for All Urban Consumers (CPI-U) increased 0.3 percent in January on a seasonally adjusted basis, after rising 0.2 percent in December, the U.S. Bureau of Labor Statistics reported today. Over the last 12 months, the all items index increased 3.1 percent before seasonal adjustment.

The index for shelter continued to rise in January, increasing 0.6 percent and contributing over two thirds of the monthly all items increase. The food index increased 0.4 percent in January, as the food at home index increased 0.4 percent and the food away from home index rose 0.5 percent over the month. In contrast, the energy index fell 0.9 percent over the month due in large part to the decline in the gasoline index.

While the chart below shows the past 12 months, it should be noted the end of 2022 also saw a downward trend, prior to 2023 rises. The January number reverses the 2023 fall downward trend and achieves an all time high.


On the other hand, my own personal CPI rate has continued upward, with a decent jump last month.


That is 2.3% annual, with a sharp 0.6% increase for January. The reason mainly being under the medical category and the fact it takes up much more weight, than the BLS weighting does. Hopefully that trend doesn't continue, but after all the "medical" adjustment to the CPI now finished... look out! 

As a side note the R-CPI-E was up 0.6% for the month and 3.5% annual. (R-CPI-E= Research consumer price index for Americans age 62 years of age and older).

Also, the gasoline index is now popping, after actually falling in January. Again... look out!!

As for Real Earnings.


Weekly wages seem to be slowing for some reason, which is reflected across the board, to the working stiffs.


Not a really bad report, but be on the outlook for any worrying trends to develop, imho.

Still, the overall seems to be easing off, even if a hiccup here and there. 

Thursday, January 11, 2024

BLS Data Dump. CPI - January 11, 2024

First up is the BLS Report for CPI...(historical releases)

Not sure what the hoopla is about, regarding coming in hotter than expected. Factoring the rounding, it was just a few basis points above my expectations.

The index for shelter continued to rise in December, contributing over half of the monthly all items increase. The energy index rose 0.4 percent over the month as increases in the electricity index and the gasoline index more than offset a decrease in the natural gas index. The food index increased 0.2 percent in December, as it did in November. The index for food at home increased 0.1 percent over the month and the index for food away from home rose 0.3 percent. 

I highlighted a portion of that statements, as it is weird as heck. Gasoline in the November report was 297.598 and December gave a 280.289. Granted that is "unadjusted", but seriously... where did the increase in gasoline index come from? Nationally, the prices are down from last month, about 18¢ and down about 9¢ from December of 2022. Yet, somehow the "seasonally adjusted" edged up enough to offset something else.

Even by the BLS numbers from December, 2022... gasoline fell -1.5% (unadjusted)  on the month and was -9.4% on the seasonal adjustments. December, 2023... saw gasoline fall -1.9% on the unadjusted monthly, ... but rose +0.2 of the seasonal adjustments.  

In any case, the top number has decreased for 3 consecutive months. Now that would be seasonal, as November and December of 2022... saw decreases. It reversed in the January 2023 report.

My own personal CPI looks like this...
That is a +2.2% increase annually, and +0.1% for the month.

As for Real Earnings.


Remember when covid disrupted everything and massive shutdowns, layoffs, etc. Comparing that $380.95 real weekly earning, compared to February, 2020's $378.92. 

It is better than nothing!

Tuesday, December 12, 2023

BLS Data Dump. CPI - December 12, 2023

First up is the BLS Report for CPI...(historical releases)

The Consumer Price Index for All Urban Consumers (CPI-U) increased 0.1 percent in November on a seasonally adjusted basis, after being unchanged in October, the U.S. Bureau of Labor Statistics reported today. Over the last 12 months, the all items index increased 3.1 percent before seasonal adjustment.

I think the numbers were somewhat in line with everyone's expectations.

I do find the food portion of the darn thing a bit intriguing.


While the overall index has increased 17.4% since January, 2021, the food at home index has jumped 20.3%

Oddly, when adjusting the index to "average" household spending the food at home has jumped 29.6%, in current dollars.

What really catches the eye, is the -8.5% drop in current dollars for food away from home. This would be cafeterias, restaurants, and other places "away" from home.

This type of comparison with weightings against the index, further indicates a drop in current dollar spending for food in all categories... compared to rate of inflation.


The CPI index has an increase in prices of 20%, yet current dollar spending is 11.6%. The food away from home industry is not keeping up, as I suspect more meals are prepared at home... or people are cutting back on eating. [NOT]


Real average hourly earnings for all employees increased 0.2 percent from October to November, seasonally adjusted, the U.S. Bureau of Labor Statistics reported today. This result stems from an increase of 0.4 percent in average hourly earnings combined with an increase of 0.1 percent in the Consumer Price Index for All Urban Consumers (CPI-U).

Here is a graph...


Tis a nickel better than February, 2020. Merry Christmas!


Wednesday, January 12, 2022

Breakdown of CPI DATA and Real Earnings, December, 2021


The BLS report for December, Indicated a 7.0% yoy inflation rate with the month on month being 0.3% unadjusted of 0.5% after adjustments.

With this release comes a variety of other numbers...
I am at the 5.0% annual rate...
I had a better than expected outlook for my personal rate of inflation, but this continues to be due to medical costs rising at a much slower rate than everything else, AND at a slower rate than in recent years. I just cannot be so optimistic as to call this a long term trend.


The likelihood of January's numbers falling between 7.04% and 7.40% are fairly high at this point. While there was joy in the easing of energy prices, not sure the rough patch of weather in the next 2 weeks will not negate some of that joy. For comparison... June 1982 was 7.06% and then February 1982 was 7.62% and January 1982 at 8.39%. I throw that out as we heard highest inflation in nearly 40 years for last month and again for this month. Also, for the record, that 7.62% (2-1982) was the lowest rate since June of 1978.  

Also, beef prices are easing a bit, but Covid may mess up the work force in that category. In any case, the month to month changes will be the real guide going forward, as YOY increases might start to ease. Not that inflation is easing, but January 2021 saw inflation percolating and then lifting off in February. 

Historically, the June 1982 YOY inflation was pegged at 7.06%, compared to last months 7.04%. From there it is February 1982's 7.62%. Next month's headline will be highest inflation in nearly 40 years.

On to Real Earnings...

Basically the report indicates wages are keeping up with inflation on month to month, but still below the recent peak of September.


Friday, December 10, 2021

Breakdown of CPI DATA and Real Earnings, November, 2021


The BLS report for November, indicated a 6.8% increase from year ago and 0.5% from previous month. 

A variety of other data releases indicated many different inflation numbers...

Of course, mine is also included at 4.7%...

Going forward, the expectation is for December's numbers to rise another 0.4% for the month, or 6.98% over the past 12 months. Meaning December is likely to be between that 6.98% and 7.16%. This month's number were last seen in June 1982, when it was 7.1%. I should point out the inflation rate was falling at that time, from a high of 14.8% in March of 1980. Good times!!!

There weren't many surprises in this report, and it was near expectations... so December expectations might be on target as well or possibly above, as the misses of late, have been on the underside. 

Real Earnings were also released...
The hourly real rate slipped a bit and is now back to March 2020 levels.

Despite the real hourly rate being near March 2020, real weekly earnings are still a few dollars above. 


Wednesday, November 10, 2021

CPI for October, 2021


Holy Toledo!!! And other places as well. The CPI-U came in at a staggering 6.2% YOY, well above anybody's expectations. Although given yesterday's PPI, the expectations should have been revised upward. 

There were no hints of slowdown in nearly any category, with maybe the medical category, which has been rather benign over the past 12 months. I cannot accept that as being a long term trend, no matter how much I wish it were true. 

Even my own personal household cpi rate, woke me up. While not in the same impact as the CPI-U, it was 

4.16%, with the monthly increase similar to the CPI-U.

Realistically, my being under the CPI-U is largely due to hoarding prior to the referenced timeframe and subsequent easing of quantities. Seriously, there are only so many cans of pork and beans that a person can eat in a lifetime. (Unlike the annual revision of various weighting of items, I revise monthly.)

The Real Earnings report was also released. While it is oft cited that wage increases are inflationary, it should be pointed out that current wage increases are a result of previous inflation.
Real Hourly earnings based in 1982~1984 dollars, fell this past month, as did a dip in hours worked, which translates into even steeper weekly earnings drop. 

With both Producer prices at the final and intermediate demand levels still rising, it is hard to foresee any glimpse of peaking anytime soon. Then there is the importation of inflation. We are a net importer and inflation is ramping up among our trading partners. 

Most notably would be China, where producer price inflation is north of 10%, but where the Government is forcing producers to hold the line to keep Chinese consumers in the 1% inflation range. 

How could these companies survive in such a climate? Cranking up prices well beyond 10% for foreign customers.  Some of that is likely a part of the intermediate demand increases, which are not tapering at this time. 

The forecast for November is 6.6%~6.9%. October was 6.2% compared to a 5.7%~5.9% expectation. For the record, 6.6% would be the highest since June, 1982.

Then there is some theoretical relief from the Federal Reserve, with an interest rate increase to slow inflation. The FED looks that the CORE inflation and not the core CPI-U from the BLS, but rather the Core of the PCE, from the BEA. 

The FED has frequently cited the need to establish this Core at 2%... over a period of time. Not real sure what the timeline would be, but the past 5 years has shown a 2.11% annual rise. Yet the thinking is the FED action will not happen until next summer. 

The problem is the FED is stuck between a rock and a hard place. When that theoretical raise occurs, the capital/financial markets could be damaged. 

In my opinion, the FED keeps talking up transitory, while hoping the consumer finally capitulates on spending due... to inflation. They can then claim they were right all along.

It is so difficult to remain optimistic. 


This Week in Petroleum Summary May 8th, 2024 per EIA.GOV

This week's  full report . Gasoline fell -2.3¢ for the week, but remains +10.3¢ from year ago level. Consumption did edge up this past r...