Showing posts with label news. Show all posts

Friday, July 28, 2023

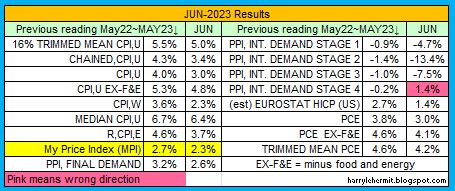
Review of June data and the July PCE Report

A story of glass half empty versus a glass half full...

For months on end, the data has contained revisions of prior months being downward, which gave that current report a glass half empty kind of vibe.

For the past two months... the previous months data has been revised upward, which emits a vibe of glass half full for the current month.

That's a positive, imho.

https://www.bea.gov/news/2023/personal-income-and-outlays-june-2023

Certainly a downward trend is in full view across the board, when mentioning inflation...

The Annual PCE, ex food and energy, is also slipping.

This is good news, as it indicates "sticky" prices are starting their downward slide. Just in time, as energy prices seem to be edging up and food prices may as well. Not everything is rosy, but optimism is not unreasonable. 

EXCEPT, next month's projections are for PCE to come in around 3.4% and core at 4.4%. Is that the last dying gasp of inflation, or signs of things to come?


Thursday, July 27, 2023

Quick Review of The Advance GDP report 2Q-2023

First off... a screen shot with some additions.


The report has some positives and some concerns. I would agree with the media reports of Gross private domestic investment carrying the load for the quarter, but is it sustainable... given recent slides and spikes.

I am a bit concerned about the Personsal Consumption Expenditures category, as it gives the appearance of losing steam. As the 70.7% indicates... it is a large part of the economy. It did gain, but lagged the overall. Additionally, the was quite a drop from 1Q performance, which itself was stellar... compared to previous recent quarters.

The trade deficit is weighing as heavily as some recent reports and is back into 2021 range. The big question is whether this will continue.

Lastly... government spending. I am a bit old fashioned, as I consider government spending as something that should match, but never exceed the overall economy... unless some dire circumstances are present. Not seeing that at present.

Friday, July 21, 2023

Natural Gas Inventory Report, July 21, 2023

The Energy Information Administration released their weekly report yesterday.

Nationally, the inventory number continue to stay above the 5 year seasonal average.


The Pacific Region continues to gain, with last week's numbers, at -7.9% vs. -9.3% of one year ago. The 5 year seasonal numbers continue to improve.
In California, the price at PG&E Citygate in Northern California rose 57 cents, up from $4.32/MMBtu last Wednesday to $4.89/MMBtu yesterday. The price at SoCal Citygate in Southern California increased $2.24 from $3.40/MMBtu last Wednesday to $5.64/MMBtu yesterday. Natural gas consumption in the electric power sector increased by 84% (1.3 Bcf/d) in California and by 10% (0.3 Bcf/d) in the desert Southwest this report week

 Select inventories of EU and UK... 

Total EU rose to 82.53%, from last week's 78.63%.

It should be noted that Gas in storage does not represent usage. An Example would be Germany has 212+ TWH in storage, but consumed approximately 847 TWH in 2022, which was a 17% decrease from 2021.

The following contains pricing information, that is based in Mmbtu and converted to US dollars for comparison purposes only. Forex is used for this comparison and should be noted that actual exchange rates on delivery may vary. 

Simply put... The EU and UK consumers do not use US Dollars, so be wary of these charts.


Snapshot of the past, the current and the future outlook for prices.
Just for comparison, the UK current pricing would suggest £1,522.06 per annum, while the 12 month high (FEB-24) would suggest £2,286.37. OFGEM has a cap around £2,047, which is line with the October futures.

Friday, July 14, 2023

Natural Gas Inventory Report, July 14, 2023

The Energy Information Administration released their weekly report yesterday.

Nationally, stocks continue to be above the mid point of 5 year range. However... once again the Pacific.

While the Pacific gained this past week, it only matched the curve for time of year.
Prices increased in most West Coast markets this week, except at SoCal Citygate in Southern California, where the price decreased 45 cents from $3.85/MMBtu last Wednesday to $3.40/MMBtu yesterday. Natural gas consumption in California declined 8% (0.4 Bcf/d) week over week, led by a 26% (0.5 Bcf/d) decrease in consumption in the electric power sector, according to data from S&P Global Commodity Insights. 

Select inventories of EU and UK... 

Total percent of capacity rose this past week to 80.76%.

The near term Natural Gas Prices for the EU and UK fell this past week. (Note: figures are in dollar terms and Mmbtu.)
Not surprisingly, the high 12 month also slipped. Currently that 12 month high is January, 2024.

Just for comparison, the UK current pricing would suggest £1,484.27 per annum, while the 12 month high (Jan-24) would suggest £2,235.81. OFGEM has a cap around £2,047, which is line with the October/November futures. (Note: The OFGEM cap reduction is more of a reduced consumption number, not so much as lower price per unit. Make of that, as you wish.)


While it could be said that EU and UK natural gas prices are skirting with levels not seen in 2 years, there is still angst in their markets. 


Friday, July 7, 2023

Natural Gas Inventory Report, July 07, 2023

The Energy Information Administration released their weekly report yesterday.

And as customary... the Pacific Region.


In California, prices declined week over week but remained elevated compared with other U.S. pricing hubs. The price at SoCal Citygate in Southern California decreased 98 cents from $4.83/MMBtu last Wednesday to $3.85/MMBtu yesterday. Consumption of natural gas in the electric power sector in California increased by 92% (1.0 Bcf/d) week over week, as temperatures increased. 

Select inventories of EU and UK... 

Yes, I am aware the capacity numbers change from time to time. Why... I don't know. If it troubles you... then you can figure it out.

While up in many area, the EU wide number slipped to 78.63%, from last week's 78.86%. Still remarkably high for the season. 

A brief look at the 12 month highs for futures... TTF (EU) and UKG (UK).


Showing an upward drift.

However, current week ending prices...


Snapshot of the past, the current and the future outlook for prices.

Just for comparison, the UK current pricing would suggest £1,578.22 per annum, while the 12 month high (Jan-24) would suggest £2,318.11. OFGEM has a cap around £2,047, which is line with the October futures.

It should be noted the OFGEM cap reduction was more of a reduced consumption number, not so much as lower price per unit. Make of that, as you wish.

Friday, June 30, 2023

Review of PCE, GDP, etc., for end of June, 2023

Another month to review (with some comments at the end)...


The following looks good, except....


The outlook for core is actually higher than the total inflation. Which means food and energy are the main drivers of overall lower inflation. Sounds good, except it really isn't food as much as energy. Energy crested in June of last year and then quickly slid... going into September. 

Just saying, the falling overall inflation numbers may come to an abrupt halt in the fall.

Now for the adjustments...


Now for the GDP...

The updated estimates primarily reflected upward revisions to exports and consumer spending that were partly offset by downward revisions to nonresidential fixed investment and federal government spending. 

I highlighted my area of concern. Note the statement of upward revision in consumer spending, then review the PCE expenditures directly above. January was good and presumably the revision upward in February would match up with the quoted statement.

However, April was revised up a mere +0.2 from original flat and May is also flat. 

So where is the growth coming from in the 2nd quarter?


Natural Gas Inventory Report, June 30, 2023

The Energy Information Administration released their weekly report yesterday.


As always... the Pacific Region...

Prices increased in all West Coast markets this report week. At PG&E Citygate in Northern California, the price rose 96 cents from $3.02/MMBtu last Wednesday to $3.98/MMBtu yesterday. The price at SoCal Citygate in Southern California increased 3 cents from $4.80/MMBtu last Wednesday to $4.83/MMBtu yesterday. The price at Sumas on the Canada-Washington border rose 59 cents from $2.02/MMBtu last Wednesday to $2.61/MMBtu yesterday.

Select inventories of EU and UK... 

Overall, very good, with EU wide numbers at 78.86% full.

A brief look at the 12 month highs for futures... TTF (EU) and UKG (UK).

A slight uptick for the 12 month, but still below the 5-5 picture. 

Current week ending prices...


Current futures (August v 12 month high)


Basically, the current futures are about where they were 2 years ago, when the EU was worried about Russia messing with natural gas deliveries and woefully inadequate natural gas stocks. 

Has the storm been weathered? 


Friday, June 23, 2023

Natural Gas Inventory Report, June 23, 2023

The Energy Information Administration released their weekly report yesterday.


As always... the focus is on the Pacific Region...
Along the West Coast, prices increased this week, in line with the Henry Hub, even as consumption in California declined slightly week over week. The price at PG&E Citygate in Northern California rose 16 cents, up from $2.86/MMBtu last Wednesday to $3.02/MMBtu yesterday, while in Southern California, the price at SoCal Citygate increased more than any other major hub this week, rising $1.67 from $3.13/MMBtu last Wednesday to $4.80/MMBtu yesterday.

Select inventories of EU and UK... 

Virtually all areas continue to increase NG in storage. Despite the hysteria, NG futures continue to ease, both nearby and 12 month... on the EU and UK market, with the Henry Hub, up slightly.


A brief look at the 12 month highs for futures... TTF (EU) and UKG (UK).


Recently, I have noticed some articles stating how the EU/UK natgas prices are surging and giving many reasons. Even one that was AI generated. 

Yet these hysterical articles don't seem to hold up for very long.


Surging... compared to what?


Friday, June 16, 2023

Natural Gas Inventory Report, June 16, 2023

The Energy Information Administration released their weekly report on yesterday.


Once again, let me focus on the Pacific Region...

Along the West Coast, prices decreased this week, but remain relatively high, particularly in California. The price at PG&E Citygate in Northern California fell 86 cents, down from $3.72/MMBtu last Wednesday to $2.86/MMBtu yesterday. The price at SoCal Citygate in Southern California decreased 16 cents from $3.29/MMBtu last Wednesday to $3.13/MMBtu yesterday. Consumption of natural gas in the electric power sector in California decreased by 7% (0.1 Bcf/d) week over week, as temperatures were relatively mild. In the Sacramento Area, temperatures averaged 68°F this week, leading to 12 fewer CDDs than last week, while in the Riverside Area, inland from Los Angeles, temperatures averaged 65°F this week, leading to 1 fewer HDD and 5 fewer CDDs than last week.

Select inventories of EU and UK...


Inventories continue to improve... over historic highs for this time of year.

NatGas Price chart...

The sky is falling...


The past 2 weeks have seen sudden spikes in EU and UK futures. This is being attributed to a host of things that have been known to take place. 
  • The Dutch are shutting down the largest gas field in Europe.
  • Norway is doing maintenance on their equipment.
Nevermind where the price was just 6 weeks ago. It reminds me of the gold bug syndrome. Time to talk of gloom and doom, to unload those holdings.

Until next week. 


Friday, June 9, 2023

Natural Gas Inventory Report, June 09, 2023

The Energy Information Administration released their weekly report on yesterday.


And now a look at regional, specifically Pacific.


Prices in West Coast markets remain the highest of all major pricing hubs this report week. The price at PG&E Citygate in Northern California rose 65 cents, up from $3.07/MMBtu last Wednesday to $3.72/MMBtu yesterday. The price at SoCal Citygate in Southern California increased $1.11 from $2.18/MMBtu last Wednesday to $3.29/MMBtu yesterday. The price at Sumas on the Canada-Washington border rose 47 cents from $1.70/MMBtu last Wednesday to $2.17/MMBtu yesterday. Natural gas consumption in the Western region increased by 13%, or 0.9 billion cubic feet per day (Bcf/d), which was led by a 38% (1.0 Bcf/d) increase in consumption in the electric power sector, according to data from S&P Global Commodity Insights.

Select inventories of EU and UK...


Prices rose sharply on the EU and UK markets this past week. Nearby by months by 8% with max 12 month at 2.5%.

I have no real explanation, as I never bothered to research reasons. Although it is not so unusual for summer months, for there to be a spike. Afterall... hot weather is here.

Saturday, June 3, 2023

Natural Gas Inventory Report, June 02, 2023

The Energy Information Administration released their weekly report on Friday.


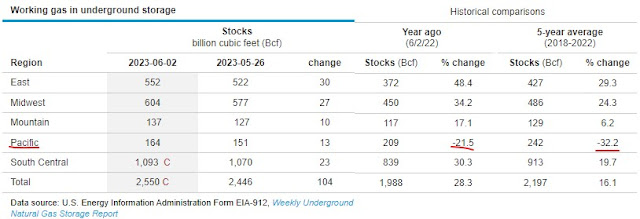
The national inventory stock remains above 5 year average and is keeping pace with seasonal movements. As usual, the Pacific region is lagging, but showing significant gains each week.


Select regional spot prices: Natural gas spot prices fell at most locations this report week (Wednesday, May 24, to Wednesday, May 31), except for prices in the Northeast. Price changes at major pricing hubs this report week ranged from a decrease of 29 cents/MMBtu at the Waha Hub in western Texas to an increase of $3.30/MMBtu at the Algonquin Citygate in the Northeast.

Select inventories of EU and UK...

Prices continue to fall on the UK and EU markets. The UK spread of 12 month futures is annually at £1,441.34 ~ £2,174.50, with OFGEM setting the cap at £2,074. That cap is consistent with NatGas prices of £94.51 per Therm or $11.76 per MMbtu. November futures rise above the cap.


The lowering of the (annual) energy cap from £2,500 to £2,074 is certainly a great relief, however it was only 2 years ago, it was something like £1,200 annually for the average household. The monthly energy charges have fallen substantially and is reflected in the U.K. CPI
  • gas provided a downward contribution of 0.75 percentage points to the monthly change in CPIH
  • electricity provided a downward contribution of 0.67 percentage points to the monthly change in CPIH.
 
Energy costs have abated, but elsewhere is very troubling, in my humble opinion.  

A Foray into the 2024 Presidential Election, Part XVI

Really not seeing any major shifts, although the Minnesota margin widened ever so slightly. Still too difficult to read. The unadjusted poll...