Showing posts with label revisions. Show all posts

Friday, September 29, 2023

Review of August data and the September PCE Release

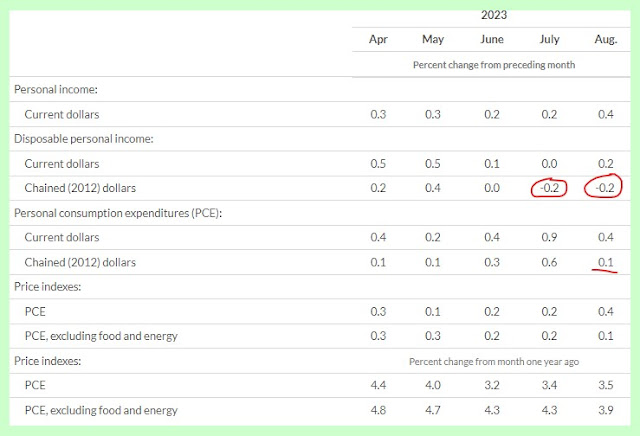
Yep, today's report was positive, with an uptick of +0.4%. That being in current dollars and when adjusted for inflation became... -0.2% for the month to month. The good news was the year to year inflation adjusted +0.1%. 

I did not denote the various changes from previous month's release, so but can be seen in previous publications.


It should be noted that multiple adjustments were made to previous readings, as indicated below...


The FED chain type report of PCE, excluding food and energy was adjusted to 2017 from previous 2012.


The 3.9% current, hearkens back to May of 2021, when things were transitory. The signs are pointing downward, but that 3.0% target remains distant, imho.

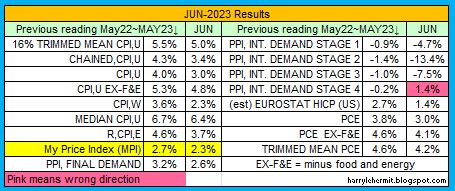
The scorecard for this month looks like this.

If I were grading this report, it would be 47.1%, compared to last month's 52.9%. Translation: My confidence in inflation heading towards 2.0% is not as great as some are predicting. 

Thursday, August 31, 2023

Review of July data and the August PCE Release

Some ups and some down in the latest release from the BEA. (red revised down, green revised up).

Chained dollar disposable income was revised down for April and June, with a negative print on July.

However, the chained dollar PCE was revised down for March and May, with upward revisions in April and June. 

It seems evident that savings AND debt are currently driving the economy. How long that can last is the big question.

Then there is the matter of PCE Excluding Food & Energy. If the target is 2%, then there is a way to go, given the forecast for August is at 4%. Years ago, when the PCE ex food and energy was failing to achieve even 2%, there was discussion of moving the target to 4%. 

That hasn't happened, so how can it be expected for the FED to ease off the interest rates? 

https://www.bea.gov/news/2023/personal-income-and-outlays-july-2023
We are now 28 months with the PCE ex food and energy above the 2% mark, and 17 months into the FED increasing rates. 10 months out, with the aforementioned halting its rise. 


The chart below indicates some problems still within the system. Last month had just one category in pink. 

We are at the end of August and its data will likely be similarly ugly. Let's hope for some relief in September. 


Friday, July 28, 2023

Review of June data and the July PCE Report

A story of glass half empty versus a glass half full...

For months on end, the data has contained revisions of prior months being downward, which gave that current report a glass half empty kind of vibe.

For the past two months... the previous months data has been revised upward, which emits a vibe of glass half full for the current month.

That's a positive, imho.

https://www.bea.gov/news/2023/personal-income-and-outlays-june-2023

Certainly a downward trend is in full view across the board, when mentioning inflation...

The Annual PCE, ex food and energy, is also slipping.

This is good news, as it indicates "sticky" prices are starting their downward slide. Just in time, as energy prices seem to be edging up and food prices may as well. Not everything is rosy, but optimism is not unreasonable. 

EXCEPT, next month's projections are for PCE to come in around 3.4% and core at 4.4%. Is that the last dying gasp of inflation, or signs of things to come?


Friday, June 30, 2023

Review of PCE, GDP, etc., for end of June, 2023

Another month to review (with some comments at the end)...


The following looks good, except....


The outlook for core is actually higher than the total inflation. Which means food and energy are the main drivers of overall lower inflation. Sounds good, except it really isn't food as much as energy. Energy crested in June of last year and then quickly slid... going into September. 

Just saying, the falling overall inflation numbers may come to an abrupt halt in the fall.

Now for the adjustments...


Now for the GDP...

The updated estimates primarily reflected upward revisions to exports and consumer spending that were partly offset by downward revisions to nonresidential fixed investment and federal government spending. 

I highlighted my area of concern. Note the statement of upward revision in consumer spending, then review the PCE expenditures directly above. January was good and presumably the revision upward in February would match up with the quoted statement.

However, April was revised up a mere +0.2 from original flat and May is also flat. 

So where is the growth coming from in the 2nd quarter?


Saturday, May 27, 2023

Review of PCE, GDP, etc., for end of May, 2023


There was a "surprise", as the PCE EX FOOD and ENERGY was higher than forecast. I am not sure why it was a surprise, as the forecast I saw... was for 4.7%. 


Perhaps the surprise was no downward revisions.


I would think the 0.0% rise in chained (2012) dollars for Disposable personal income, compared to PCE of same being at 0.5% would raise some eyebrows. But it is a credit driven economy, so what the heck. Going deeper in debt is the national pastime. 

Even the GDP was touted as going up from advance estimate of 1.1% to 1.4%, as being stellar. While ignoring the GDI for 4th quarter 2022, was revised sharply downward from -1.1% to -3.3%. The GDI for 1st quarter, 2023 came in at a -2.3% mark. 

In any case DPI now stands at +2.6% above the 1st Quarter, 2020 level. Presented without further editorial comment.


Friday, April 28, 2023

Review of PCE, GDP, and other Nonsense, for end of April, 2023

I found some things of interest in the GDP and PCE reports, but first... the usual nonsense.

The sticky prices continue to be the story. 

The 4.6%, in today's report, takes us all the way back to October, 2021 and 4.3%. About the time a suggestion was made to end the use of transitory.

The following chart is a snapshot of this month's report, compared to last month and the revisions are highlighted in red. Nothing sinister, as this happens frequently as it is based on incomplete data, that becomes more complete as time passes. 

In short... this month's data could be revised up or down by next month.

In any case, the PCE came in at expectations. Services saved the day, but before you think of restaurants as services... it is, but on about 18%. Think housing and utilities, which were a bit hot, imho.

Unfortunately, the expectations are a bit higher for April's PCE report. PCE at 4.5 and core at 4.7

GDP came in a surprise 1.1% annualized. The forecast I was looking at, was around 2.0% annualized. The problem with the downside surprise, is the -1.8% forecast for 2nd and 3rd quarter, with -0.6% for the 4th quarter.

The shocker was in the change in private inventory sector, which was -1.6, compared to last month's +136.5. The reason for such a number is where the big story might be. But, I am too tired to contemplated that any further on a Friday night.

Have a nice weekend!

Saturday, April 1, 2023

Review of PCE, GDP, and other Nonsense

So here is the various inflation numbers...

Click image to enlarge
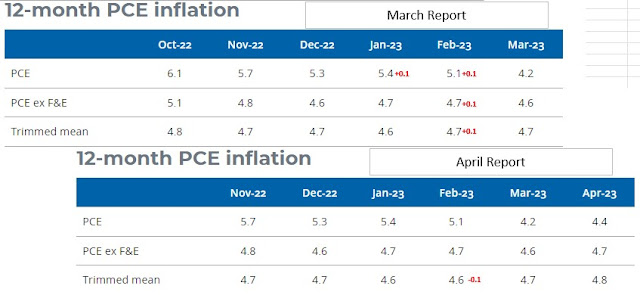
This also, includes the latest revisions in the PCE release. I include the previous month's report to indicate any revisions.
Click image to enlarge
For reference only, the PCE ex food and energy, has increased 10.3%, from February, 2021. The cpi-u ex food and energy, increased 12.3% over that period. The CPI including food and energy has risen 14.4%. 

I guess my 1st point being... back in the transitory days of inflation, with it around 5.5%, the prices did not stop rising. So 5.5%, really was transitory. The March data should be slightly below that transitory number, yet I don't expect those proponents of transitory to come out saying... see I told you so. 

The 2nd point being... we were upset when inflation was eroding our purchasing power between 4%~5%, so the sticky prices (ex food and energy) seem to be stuck in that range. Smarter minds than me, forecast core PCE to achieve that noble 2% target in late 2024.

I am beginning to think a recession will be necessary to bring down those sticky prices, although those smart minds are already forecasting 3 consecutive quarters of negative GDP, beginning in 2nd Qtr, 2023. Which brings me to GDP.

Being a glass half full kind of guy, I look for the potential problem areas in reports, such as the GDP. It strikes me that the increase in inventories and the net deficit of imports/exports, erases that 2.6% annualized to 0%.

Going forward, I would anticipate the net deficit in imports/exports to slightly increase for the 1st quarter, and inventories to remain steady or slightly increase. Which requires the other categories to do the heavy lifting. You guessed it... it largely falls on the consumer.

I have completely wasted a few hours on this article, and it is time to enjoy Saturday.
Friday, February 24, 2023

PCE Revisions and End of Month Inflation Results (All Reports)

So here it is...

Click on image to enlarge
This also, includes the latest revisions in the PCE release. I include the previous month's report to indicate the revisions.
Click on image to enlarge
You will notice some sharp upward revisions, compared to last month. That +0.6% M/M increase was after the major adjustment in December's numbers. Without that December adjustment, that +0.6% would have been much higher. 

Don't worry too much, as these numbers get adjusted on a regular basis. It does serve to point out that inflation is not falling off a cliff.

The good news would be the "trimmed mean PCE". It actually slid -0.1%, after holding at 4.7% for the preceding 5 months. 

The BEA Report. The Dallas FED Report. For a breakout of "trimmed"... It is an Excel download. Of the 54 items not trimmed, I utilize 7 (13%.) Of the 121 trimmed out, I utilize 42 (34.7%.)

Oh well, my own CPI is 5.5%. Using the trimmed mean, it is 4.9% v the FED's 4.6%. 

I would write about the GDP, but it gets revised on a regular basis. Next month will be revised and the annual revision in July will take place for all. Sometimes, as much as 3.0% change from the original advance release.

This Week in Petroleum Summary May 8th, 2024 per EIA.GOV

This week's  full report . Gasoline fell -2.3¢ for the week, but remains +10.3¢ from year ago level. Consumption did edge up this past r...