Wednesday, April 12, 2023

Crude and Petroleum Product Inventories - APR 12 2023

Today's EIA.gov report

Crude stocks grew, +597K barrels, from last week, although still at +1.0% above the 5 year seasonal average. It should be noted the 5 year average includes the abnormal 2020 and 2021 number. Otherwise, the current inventory is nearly +6.0% above normal.

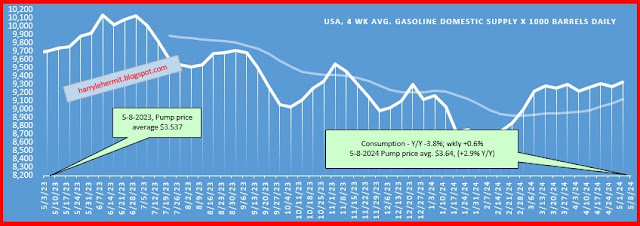
Distillates fell -606K Barrels; and Gasoline slid another -330K barrels. The SPR fell -1.6M barrels.

WTI has risen to $83.21, compared to $80.54, one week ago, and $99.40, one year ago. OPEC + did announce substantial output cuts, but the when, where and who, remains to be seen. The price jump is basically an expectation of China's economy regaining footing. 

Refinery output edged up on a weekly basis, but still below one year ago levels. I would make an assumption that the lag is due to refinery maintenance.

For anyone interested, the U.S. has exported 591.9M barrels of crude and petroleum products, more than imported, since March 1, 2022. 1.4M barrels this past week, which is well below previous weeks. It appears to be in crude exports being abnormally low. Maybe a tanker didn't sail on time?

Overall, crude stocks remain quite healthy, compared to this time last year, with days supply at 30.2, compared to last year's 26.7 days.

While crude inventories remain in decent shape, the refining part of the equation is still lagging, compared to one year ago. 

I am, also, puzzled by the gasoline side, as importing more than exporting... is somewhat of an anomaly.


Real Earnings: April Release of March 2023 Data

The BLS has released the latest Real Earnings Report

All employees

Real average hourly earnings for all employees increased 0.2 percent from February to March, seasonally adjusted, the U.S. Bureau of Labor Statistics reported today. This result stems from an increase of 0.3 percent in average hourly earnings combined with an increase of 0.1 percent in the Consumer Price Index for All Urban Consumers (CPI-U).

Real average weekly earnings decreased 0.1 percent over the month due to the change in real average hourly earnings combined with a 0.3-percent decrease in the average workweek.  

Real average hourly earnings decreased 0.7 percent, seasonally adjusted, from March 2022 to March 2023. The change in real average hourly earnings combined with a decrease of 0.9 percent in the average workweek resulted in a 1.6-percent decrease in real average weekly earnings over this period.

Now for some comparison graphs, dating back to February 2020, or pre-covid. It is important to compare to that date, as the rates were distorted with all the layoffs early on. Remember... A lot of people were working from home, etc. A lot of people did not have that option.
The above rate is still a shade below February 2020.

The above rate is still a shade below February 2020.

The above rate is 14¢ higher than February 2020.

The above rate is $6.50 higher than February 2020.

It is better than losing ground, but not sure it is a sign of "real" progress.

CPI Latest DATA results, Reports for March 2023

The BLS report was released this morning and it was a shade below consensus estimates. (historical releases)

The Consumer Price Index for All Urban Consumers (CPI-U) rose 0.1 percent in March on a seasonally adjusted basis, after increasing 0.4 percent in February, the U.S. Bureau of Labor Statistics reported today. Over the last 12 months, the all items index increased 5.0 percent before seasonal adjustment.

The index for shelter was by far the largest contributor to the monthly all items increase. This more than offset a decline in the energy index, which decreased 3.5 percent over the month as all major energy component indexes declined. The food index was unchanged in March with the food at home index falling 0.3 percent.

The index for all items less food and energy rose 0.4 percent in March, after rising 0.5 percent in February. Indexes which increased in March include shelter, motor vehicle insurance, airline fares, household furnishings and operations, and new vehicles. The index for medical care and the index for used cars and trucks were among those that decreased over the month.

A couple of notes... "all major components declined". That is with "seasonal" adjustment. While the overall index eased, the gasoline component was up +1.0% and is currently on the rise for April, as in +3.0%. Be careful of the spin.

Food at home, did drop, but that food away from home... seems to be hanging tough.

The real story is sticky prices, or Core, or CPI ex- food and energy. It actually rose on an annual basis, and was above expectations on the monthly. It would have been even worse, but the Medical side inexplicably fell. If it had remained flat, you could add another +0.1% to that Core.

Simply looking at the core at 5.6%, with the overall being 5.0%... should tell you that drops in energy is where the most savings are. Further browsing through the numbers, indicate most items, other than gasoline are where those savings are. How much longer can that last?

The forecast indicates an increase in Core, with the overall remaining at current level of +5.0%. So clearly the big brains think it will continue. The may be right, but the politics of pump prices, tends to overshadow all the other energy components. 

Generally speaking, those winter heating bills drop and consumers don't really recognize the cost per unit difference. Gasoline is right in your face at the pump... and everyone seems to recognize that cost per unit.

My own personal CPI...
I guess I should be happy with the +0.1% M/M, and +4.0% Y/Y, but I don't like inflation of any type. 


Thursday, April 6, 2023

Natural Gas Inventories look to be good, except on the left coast.

The Energy Information Administration released their weekly report Thursday.

In great shape, except for the west coast...

So prices are down in most regions, with the exception of above. With warmer weather, some improvement should occur in those regions.

However, that leaves much of the country outside the Mountain and Pacific regions at +48.1% above this time last year, and +31.6% above the 5 year seasonal average. Including the Mountain and Pacific regions, you get...
So it really should come as no surprise that Henry Hub prices are this low. At some point, the average price of inventory is reduced enough to feed into the regular economy... and slowly bring down consumer expenses, related to natural gas. It might have started in February. 

The question with the prices this low... will household energy prices reflect this in the near future? IF prices continue at this low point, then it would not be unreasonable to expect that part of the energy component in the CPI, to retrace back to spring 2021... by late summer. 

Could they go lower? That might be wishful thinking.

The same cannot be said for Europe. Futures pricing is still triple 2 years ago. Considering the hefty condition of their inventories and also considering the likely average price of those inventories... Triple may become the norm. That is without the anticipated rise going into next winter.

Not sure how all this will play out, with the price schemes, caps, subsidies, etc. and future implications of a return to the principles of the Maastricht Treaty. 

Wednesday, April 5, 2023

Gasoline consumption through last Friday, Mar-31-2023

Gasoline prices were (per AAA) were up 6.7¢ this week, to $3.528. A year ago, the price had ballooned to $4.176. I projected a 4.5¢ increase, and wish it hadn't happened.

The  consumption edged up a healthy +1.4% from last week, and jumped 3.3% above year ago numbers. (This is a four week moving average). 

Click on image to enlarge
If you are really into this type of thing... the import/export surplus of gasoline since last March 1st 2022, stands at +99.5M barrels. This is a global market, so the global economy, as well as refinery output, is key to where pump prices will be.

Where will pump prices be next week? Last week, I forecast a +4.5¢ increase and got a +6.7¢ rise. I hope my inability to accurately predict prices remains opposite of what takes place. At least for the coming week. 

So, it looks like a +12.5¢ increase at the pump. Here's hoping I am wrong.

Normally, consumption eases during this current period, but warmer than seasonal weather must be enticing those with cabin fever... to drive.

Will the national average get to $5? I really want to say no, but with gasoline inventory below this time last year, consumption above this time last year, and refinery output below this time last year... It is hard to build a case against $5 gasoline. 

We have to cross the $4 threshold and that will likely happen sometime near the first of May. That is just me guessing and pulling a date out of thin air. 

I drive less that 1,000 miles a year, so don't even know why I watch this stuff so closely. 

Crude Inventories continue to drop - APR 05 2023

Today's EIA.gov report

Crude stocks dropped, -3.8M barrels, from last week, although still at +3.5% above the 5 year seasonal average; Distillates fell -3.6M Barrels; and Gasoline slid another -4.1M barrels. The SPR fell -404K barrels, ending a 10 week pause.

WTI has risen to $80.54, compared to $72.71, one week ago, and $100.68 a year ago. OPEC + did announce substantial output cuts, but the when, where and who, remains to be seen. The price jump was basically an expectation of China's economy regaining footing. 

Refinery output edged up on a weekly basis, but still below one year ago levels. I would make an assumption that the lag is due to refinery maintenance.

For anyone interested, the U.S. has exported 590.5M barrels of crude and petroleum products, more than imported, since March 1, 2022. 14.8M barrels this past week.

Overall, crude stocks remain quite healthy, compared to this time last year, with days supply at 30.2, compared to last year's 26.0 days.

While crude inventories remain in decent shape, the refining part of the equation is lagging. More on that as soon as I can run the numbers.

Saturday, April 1, 2023

Review of PCE, GDP, and other Nonsense

So here is the various inflation numbers...

Click image to enlarge
This also, includes the latest revisions in the PCE release. I include the previous month's report to indicate any revisions.
Click image to enlarge
For reference only, the PCE ex food and energy, has increased 10.3%, from February, 2021. The cpi-u ex food and energy, increased 12.3% over that period. The CPI including food and energy has risen 14.4%. 

I guess my 1st point being... back in the transitory days of inflation, with it around 5.5%, the prices did not stop rising. So 5.5%, really was transitory. The March data should be slightly below that transitory number, yet I don't expect those proponents of transitory to come out saying... see I told you so. 

The 2nd point being... we were upset when inflation was eroding our purchasing power between 4%~5%, so the sticky prices (ex food and energy) seem to be stuck in that range. Smarter minds than me, forecast core PCE to achieve that noble 2% target in late 2024.

I am beginning to think a recession will be necessary to bring down those sticky prices, although those smart minds are already forecasting 3 consecutive quarters of negative GDP, beginning in 2nd Qtr, 2023. Which brings me to GDP.

Being a glass half full kind of guy, I look for the potential problem areas in reports, such as the GDP. It strikes me that the increase in inventories and the net deficit of imports/exports, erases that 2.6% annualized to 0%.

Going forward, I would anticipate the net deficit in imports/exports to slightly increase for the 1st quarter, and inventories to remain steady or slightly increase. Which requires the other categories to do the heavy lifting. You guessed it... it largely falls on the consumer.

I have completely wasted a few hours on this article, and it is time to enjoy Saturday.

This Week in Petroleum Summary May 8th, 2024 per EIA.GOV

This week's  full report . Gasoline fell -2.3¢ for the week, but remains +10.3¢ from year ago level. Consumption did edge up this past r...