Showing posts with label BEA. Show all posts

Thursday, December 1, 2022

Incomplete Data and Hyperbole!!

The BEA released the Personal Income and Outlays, October 2022, this morning..

I have highlighted the adjustments from last month's release

You can scroll down on each month's release to examine the adjustments. It is not uncommon to have these revisions, as they are estimates and with the arrival of more data, the estimates can be further refined. Sometimes, this can result in adjustments going back a few month, as indicated by the numbers underlined in red.

In other words... the estimate is based on incomplete data. What astounds me, is the hyperbole surrounding this single report, or any other, as some signal from God... that some FED reversal is imminent. 6.0% is triple a target of 2.0%. At least it used to be, in the days before FTX.

Yes, I understand the one month PCE ex F&E was 2.7% annualized. This past July, saw that figure at 0.8% annualized. So hush! The FED probably uses a lot of data points, as well as one of those magic eight balls.


Overall inflation rates are improving across the board and it is not impossible that a more normal rate of inflation could be upon us by next summer, based on current progression. However, is that due to recessionary pressures, Federal Reserve actions, global intrigue... or any combination? 

I dunno!


Wednesday, November 30, 2022

Quick Take on GDP Revision

 The BEA release.

Real gross domestic product (GDP) increased at an annual rate of 2.9 percent in the third quarter of 2022 (table 1), according to the "second" estimate released by the Bureau of Economic Analysis. In the second quarter, real GDP decreased 0.6 percent.

The GDP estimate released today is based on more complete source data than were available for the "advance" estimate issued last month.  In the advance estimate, the increase in real GDP was 2.6 percent. The second estimate primarily reflected upward revisions to consumer spending and nonresidential fixed investment that were partly offset by a downward revision to private inventory investment. Imports, which are a subtraction in the calculation of GDP, decreased more than previously estimated (refer to "Updates to GDP").

That is good news, except when delving into the details, although still not so bad... just not so optimistic going forward. 


Considering the size of PCE relative to overall GDP, the increase is more a product of overstating the advance GDP's drop in that category. Which is a good sign, if PCE is easing back into the traditional range and all the other categories begin pulling their weight.

It should be noted, however, that consumer spending has increasingly become a greater share of the GDP. How long can that continue?


Friday, October 28, 2022

Personal Consumption Expenditures and Outlays Report - October 28th

The BEA released the Personal Income and Outlays, September 2022, this morning.

Click to Enlarge
Not real sure where the money for personal consumption expenditures is coming from, given the fall off of disposable income. Credit? Of course it is a factor, and not sure how resilient the consumer will be in the coming months, against higher interest rates.

Click to Enlarge
The pink is slowly receding from this chart, but that is more about base effects of Year over Year measurements. The Month on Month projections for October inflation are expected to be the highest... since June. 

Available stats for October would have gasoline rising +2.6%, after falling since June. According to my own personal expense tabulations... food sure isn't slowing. Of course the month is not over and something dramatic could happen to lower those two. It would take free giveaways of food and gasoline, which is not impossible... but highly improbable.

Thursday, October 27, 2022

GDP Thoughts, Natural Gas Summary

Today, we were blessed with the Advance Estimate of 3rd Quarter GDP Release, from the BEA.

You can read the report and check the data. Here are some of my thoughts. I can clearly see the GDP in 2012 dollars, increased by $126.4B. The drag of our trade imbalance slid by -$156.5B. In other words... if the trade imbalance had remained steady, everything else was negative. Throw in the gain for consumer spending of +$59.5B and the everything else is very negative.

I am not exactly optimistic going forward and fail to see much to be enthusiastic in this report. The first and second quarter trade imbalance, which had jumped dramatically was a result of early ordering to ensure on time delivery and early ordering to beat the port strike, that never materialized. 

Not sure the consumer can continue to accelerate spending in the 4th quarter, as inflation headwinds are starting to seriously erode purchasing power. 

As for the impact on GDP by inflation...

Click to Enlarge
I read the term re-balancing being used for the big change in import/export numbers. That rebalance will be not be so prevalent in the 4th quarter. Which means the consumer needs to pick up the pace to have a positive 4th quarter. I cannot see that happening. Further I have previously stated the GDP numbers for 1st and 2nd quarters were badly distorted by the trade imbalance. 

Without the trade distortions, the 1st and 2nd quarter may have been positive and the 3rd quarter slightly negative, as in that much ballyhooed 1st of 2 consecutive quarters of GDP shrinkage.

On to natural gas, with today's update from EIA.GOV.
Click to Enlarge
Inventory is still improving and pricing is also showing some declines. The latter being a result of European facilities being nearly full and LNG tankers stacking up off shore of Spain, etc. 
Click to Enlarge
This trend will not continue, as we haven't gotten to cold weather. Europe will need to be refilled for the following winter, which means another round of upward prices. Add in the addition of LNG facilities on both sides of the Atlantic, as well as many more LNG carriers... the price hikes could be steep on the USA side, although some abatement in Europe.


Friday, September 30, 2022

Finishing Up Data for September, 2022

The BEA released the Personal Income and Outlays, August 2022 and Annual Update this morning.

Click to Enlarge
Note the PCE and PCE EX-F&E were revised according to BEA listing, but not revised in the above chart.

Click to Enlarge
Chained dollars continue with upward growth.

The BEA, also released the GDP yesterday and the headlines were unchanged. However, you had to read down quite a bit to the juicy part.

Real gross domestic income (GDI) increased 0.1 percent in the second quarter, a downward revision of 1.3 percentage points from the previous estimate. The average of real GDP and real GDI, a supplemental measure of U.S. economic activity that equally weights GDP and GDI, decreased 0.3 percent in the second quarter, a downward revision of 0.7 percentage point (table 1).

The GDI (Gross Domestic Income) was +1.8% for the 1st quarter, until this revision down to +0.8% and the 2nd quarter was revised downward from +1.4% to +0.1%. Still positive, but... not by much. 
When averaged with the GDP: 1st quarter from +0.1% to -0.4%; 2nd quarter from +0.4% to -0.3%.

The 3rd quarter advance estimate will be announced on October 27th. Bet on it being positive, until after the election and the 2nd estimate comes out on the 30th of November. Okay, it will likely still be positive, so I guess the "recession" was over in June. My opinion would be, we are not yet in a recession. 

I do wonder why the theory of 2 consecutive negative quarters has such a special meaning in the hearts of so many. I mean I get it, but claiming some historical significance, when faced with something of a 21st century phenomena, doesn't make sense. Especially when so many avoid talking about it, lest they be labeled as being part of some fringe group.

Click to Enlarge
Shame on me for even pointing it out. We did this to ourselves. It is oft stated that recognizing the problem is halfway to solving it. We are nowhere near recognizing it, in my opinion. 

Now for some good news. The Centers for Medicare and Medicaid Services announced...
The standard monthly premium for Medicare Part B enrollees will be $164.90 for 2023, a decrease of $5.20 from $170.10 in 2022. The annual deductible for all Medicare Part B beneficiaries is $226 in 2023, a decrease of $7 from the annual deductible of $233 in 2022.

It is unusual the announcement could be made so early, as it usually comes in mid November, which always fall just after an election. The announcement is barely visible on all those old people boards I follow. It's still good to be able to keep and additional $62.40 per year, even if it would purchase what was $57.35 last year.

Speaking of inflation, the September numbers from the BLS will come out on the 13th of October. Here is my current projection of C.O.L.A.

Click to Enlarge

I'm struggling on whether it will be 8.7% or 8.8%. Earlier, I had 8.6% in the mix, but I think that has gone bye bye. Likely 8.8%, with a possible 8.9%. 

Frankly, the likelihood of the CPI-U jumping 0.28% and the CPI-W at 0.37% is not unreasonable, although something a bit lower on the CPI-W lands at 8.8%.

In July, the -7.7% drop in gasoline covered up all the other price inflation taking place. In August, the -10% drop in gasoline could NOT cover up all the other price inflation taking place. September is ending with only a -5.5% drop in gasoline. So look out. 

Much of the reason for the national average of gasoline prices rising the past ten days, has to do with California switching from summer blend to winter blend. It happens every year. It should begin slowing next week. 

Most Americans don't grasp that, but politicians do. So a wonderful time to point out the national average is rising, proclaim retailers must halt the exploitation and then take a victory lap next week. We Americans are such suckers.

As for gasoline prices, I am not sure what they will do, when that 1MBPD SPR release ends just before the election. Couple that with the possibility of OPEC cutting a few barrels... who knows. 

Natural Gas is staying ahead of the curve and possibly gaining some...

click to enlarge

All in all, another decent month. It could be the last for awhile, but who knows? Or rather... who cares?


Oh yes... Natural Gas prices.

Click to Enlarge
Back early in the summer, the anticipated range for U.K. energy at the average household level, was £3,600 ~ £5,400 annual, based on what the market was indicating. Currently the range is £3,000 ~£4,100. If the £2,500 cap was based on the summer forecast, then maybe the new cap should be lower. 

Oh well, smarter people than I, are working on all this. That doesn't mean they don't make mistakes. As I make a lot of mistakes and don't pretend to be smart... no one really pays attention. But when a "pretentious" person errs... it is lights out. 


Friday, August 26, 2022

GDP 2Q, 2022 2nd Est., PCE, Income and Outlays, Inflation Summary and Opinions!

The BEA released the 2nd estimate of GDP and it was revised to -0.6% annualized. You can read the link at your leisure. I am not going to yap about the data or the verbiage in the release. 

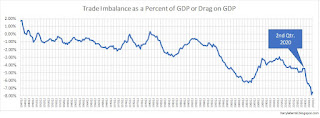
What did amaze me, was a ripple in the news about the trade deficit. Here is my updated trade deficit drag on GDP...

Click to Enlarge
The media has been reluctant to mention trade deficits, so it was a surprise to see it noted on my twitter feed. 6 straight quarters of record trade deficits to GDP and someone noticed. Also, the dollar rise seems to have awakened some, after 4 quarters of rises... amounting to 17.2% increase.

This was all yesterday's news, so onto the Personal Income and Outlays...
Personal income increased $47.0 billion (0.2 percent) in July, according to estimates released today by the Bureau of Economic Analysis (tables 3 and 5). Disposable personal income (DPI) increased $37.6 billion (0.2 percent) and personal consumption expenditures (PCE) increased $23.7 billion (0.1 percent).

The PCE price index decreased 0.1 percent. Excluding food and energy, the PCE price index increased 0.1 percent (table 9). Real DPI increased 0.3 percent in July and real PCE increased 0.2 percent; goods increased 0.2 percent and services increased 0.2 percent (tables 5 and 7).
Click to Enlarge
Note that June numbers were revised upward, 0.1% on the DPI and downward of PCE. In any case, the expenditures (PCE) is still outpacing the disposable disposable income (DPI). 

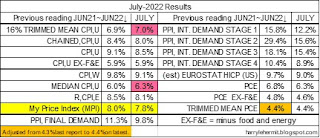
Here is a summary of various inflation gauges for July...
Click to Enlarge
It is impossible for me to finish without an opinion, although my opinion is sprinkled throughout.

As I have noted in previous articles, even the BLS stated the flat July reading was totally due to -7.7% change in gasoline prices. I would put the fall for August near the -10% range. It would seem the expectations would be for another flat month or possibly a negative print. 

But... the energy index was down last month -4.5%. There is more to energy than just gasoline as the rise in electricity was +1.9% and piped gas (N/G?) was down -3.9%. I would expect a continuation of electricity rises and a reversal of piped gas... back to increases. 

Also, the SPR release is set to halt at end of October, and OPEC is suggesting production cuts... to stabilize prices!

Diesel prices falling has shifted the past two days and is showing an upward tilt, as fall harvest is now beginning. Gasoline prices continue to fall, but we haven't had a storm in the gulf. Keep an eye on the tropics!  

Speaking of weather... food is rather dependent on the weather, with droughts inhibiting yields, and heavy rains disrupting both planting and harvesting. These weather occurrences are always an issue for someone, somewhere. The frequency and widespread occurrences, are troubling.

Fertilizer is also used to increase yields in crops, and are a global commodity. A lot of natural gas is used in the production of fertilizers. European producers of fertilizers are reducing and/or curtailing production of fertilizers... as natural gas prices have become to high to operate. 

Of course, that would be a European problem, except fertilizers are once again... a global commodity. Research phosphate, nitrogen, potash, anhydrous ammonia, etc. 

While LNG export is limited by infrastructure... these fertilizers are mostly not. So even if there is a good growing season, the cost of raising those crops will increase, due to fuel costs (diesel) and yield enhancing fertilizer.

The old adage "hope for the best, but prepare for the worst", comes to mind. Not that the worst will happen, but let's not become giddy over some short term positives about peaking inflation, etc. 

Or as Yogi said... "it ain't over, till it's over."

Friday, July 29, 2022

GDP, PCE, Income and Outlays, Inflation Summary and July Wrap-up!


The real GDP for the 2nd Quarter was released and it was below forecasts. I think it was generally in the 0.8% annualized. My pathetic attempt was 0.6% annualized. The result was -0.9%. The pundits have fixated on the falling inventories, but I noticed the imports/exports did not match expectations. 

The consumer was steadfast in increasing spending, but slowly. (Did I mention real GDP is after adjusting for inflation?)

Here is a bit of history for consumer spending relative to real GDP.
And this is fun with numbers, which is consumer spending after taking out a major contributor or detriment to GDP. I'll let you guess what that is.

While the consumer edged up, and some gains in net export, Gross Private Domestic Investment was the big drag, it was the inventory numbers that pulled it down by $107B from last quarter. That was the surprise for many people and the difference between the result and what was forecast. 


Then we have Personal Income and Outlays, which...
Personal income increased $133.5 billion (0.6 percent) in June, according to estimates released today by the Bureau of Economic Analysis (tables 3 and 5). Disposable personal income (DPI) increased $120.4 billion (0.7 percent) and personal consumption expenditures (PCE) increased $181.1 billion (1.1 percent).

The PCE price index increased 1.0 percent. Excluding food and energy, the PCE price index increased 0.6 percent (table 9). Real DPI decreased 0.3 percent in June and real PCE increased 0.1 percent; goods increased 0.1 percent and services increased 0.1 percent (tables 5 and 7). (emphasis added)

Even with disposable income sliding after inflation adjustments, the consumption increased after inflation adjustments. Borrowing?

Then the various inflation numbers...

Not much to be enthusiastic about. It would appear that some of the forecasts are starting to downgrade inflation number for July and I would tend to agree. At best it would seem to have peaked. 

As to whether we are in a recession or not... the idea of "technical" recession is an imported idea. The U.S. has never jumped on the 2 quarter as recession bandwagon. Harken back to the Great Recession. It was deemed the U.S. started into recession in December 2007, yet we did not have back to back negative GDP, until 3rd and 4th quarter 2008.

I would think we are likely heading into a recession, but not at the moment. Then the issue is how long and how deep? 

So good luck and on to next month's data. 

Thursday, June 30, 2022

End of the Month... June 2022

Okay, it is the end of June. Time for a recap of data published this month for May by the really smart guys, with comments by a really dumb person (me).

First up is the various inflation gauges...

(Note that I have estimated the Eurostat for the USA, as the official data has not been published.)

Not much relief in the inflation outlook, although demand destruction is becoming evident in certain core areas. Even gasoline and diesel usage seems to be tapering off. Prices maybe not so much... but exports are still outweighing imports.

The personal income and outlays suggest a reason for this. (click to enlarge)
Is it a one month anomaly or the start of a trend? It's possible the old adage of not being able to get blood from a turnip... may be in play.

Now on to GDP. Which slid from -1.5% to 1.6%, and the headlines are about consumer spending decreasing from +3.1% in the 2nd reading and now at +1.8%. It's the consumers fault!! The consumers still remained positive in expenditures and overall GDP fell. Aren't we overlooking that 800lb. Gorilla?

I can remember when the consumers were 60% of the economy; then 65%; then 2/3's; and now 70%. That 70% gets stated as something normal, which it isn't...
That's since early in the 80's, so what might have changed? Let me back out some numbers and see what it might look like in "fun with numbers". (You can guess what I backed out)!
The line edges up in "fun with numbers", but not like the first graph. We can't speak of that, as it is politically sensitive. The bottom line... we did this to ourselves.

I can't really say whether the 2nd Qtr. GDP will be better or worse, but 2nd quarter is over with today, so it is only a matter of waiting for the 1st read at end of July. Frankly, I think it will be positive for 2nd quarter, but the ship is starting to tilt, in my opinion. 

I can distinctly remember discussion of whether or not we were in a recession in spring 2008. I am not sure when the decision was finally made of it starting in December of 2007. It seems it was given that date after the recession "ended" in June of 2009. 

So we won't officially know whether we are in a recession, until it is over, or when the fat lady sings.  


Friday, May 27, 2022

End of the Month... April 2022 PCE, 2nd est. GDP, and Other Stuff.


The final results for April data is now in and it looks like a mixed bag. Sure the headline numbers are indicating deceleration of inflation, but there are still problem areas. The most important being my price index, which is increasing. I have highlighted some areas of acceleration of inflation. 

Remember that energy was flat for April and has risen in May, which comes out next month. The deceleration of inflation in overall CPI indicates a potential repeat of the April headline number. The core, which is without food and energy, indicates some moderation. We'll just have to wait. 

The Personal Income and Outlays for April came out and it isn't stellar in my opinion. Personal consumption expenditures were up 0.7% for the inflation adjusted month to month. The disposable personal income was flat on the inflation adjusted month to month. Credit cards anyone?

Somehow the concept of driving 120 mph on an ice covered road comes to mind, with a slight decrease in overall speed. Then the FED is slightly tapping the brakes. What could go wrong?

In other news, the 2nd release of the 1st Quarter GDP indicated a bit less than the Advance. I have read some comments about a potential negative 2nd quarter as meaning we are in a recession. WRONG! It is just a symptom. 2020 saw two quarters and no recession, as discussed by the gurus of such stuff. After debating most of 2008, it was finally decided that December of 2007, was the start of the great recession. The first back to back negative quarters were 3rd and 4th Quarter of 2008. So clearly more information than GDP numbers are a factor.

As for the 2nd quarter GDP, which will not be released until end of July... there is ample reason to believe it will not be negative. The trade numbers were a major hit to the 1st quarter GDP. The dollar has strengthened, which should reduce the deficit numbers, the inventory builds should be increasing, which is a plus for GDP, although troubling. The trade deficit should also be waning, due to a potential China slowdown.

So a positive number for GDP 2nd Quarter is in the offing... but that does not mean the economy is doing peachy keen. That expected positive inventory gain, could be a sign of demand destruction. With energy prices taking a bite out of disposable income, consumers will likely dial back in other areas.

So the outlook is a mixed bag in my opinion. A mixed bag is better than all negative, so there is some room for optimism. 

Have a good holiday!!


Thursday, January 27, 2022

2021 GDP Results and First Look at 4th Quarter 2021


Real gross domestic product (GDP) increased at an annual rate of 6.9 percent in the fourth quarter of 2021 (table 1), according to the "advance" estimate released by the Bureau of Economic Analysis. In the third quarter, real GDP increased 2.3 percent.

...

Real GDP increased 5.7 percent in 2021 (from the 2020 annual level to the 2021 annual level), in contrast to a decrease of 3.4 percent in 2020 (table 1). The increase in real GDP in 2021 reflected increases in all major subcomponents, led by PCE, nonresidential fixed investment, exports, residential fixed investment, and private inventory investment. Imports increased  

 All of which sounds really good and seems to be "great" news. Being the contrarian, I seem to find things that trouble me. The inventories and correlation to consumer spending. They look stellar on the annual basis, but 4th quarter seems troubling to me. 

The inventory numbers made up about 73% of the 4th quarter numbers. The difference being a chabe for the 6.9% annualized to something akin to 1.8% annualized. Which even at that lower number was better than the meager 0.48% rise in the goods category sans services and 3.2% annualized with services. Rah! Rah!

The report does make note of certain durable goods making up the increases in inventory, yet overall consumer spending in this category is barely making gains. That is not surprising, given the past year, but not sure how consumer spending will react going forward. 

Setting aside the inventories and intellectual property products... the Gross private domestic investment category slid -1.2% annualized. 

Personal consumption expenditures rose 3.2% annualized, but on the back of services with a respectable 4.8% annualized rise. Without the services... 0.36% annualized.

My small brain cannot find all that "wonderful" news, but I may be overthinking it, considering my small brain. 

To summarize, the consumer spending, which is the driver of the economy, is slowing considerably; the private sector sans the aforementioned... is slowing. 

So if inventory is rising dramatically, then one of the following would seem the likely cause...

  • The supply chain snarls are finally becoming unsnarled
  • Suppliers have increased production
  • Consumers are slowing their purchases

Not real sure how this can be seen in such a positive light, especially with the doldrums of winter upon us, the negative outlook of the consumers, etc. Unless the latter weighs on inflation and slows it down a bit. 

Friday, October 29, 2021

Positive Spins?


Yesterday gave us the initial 3rd qtr. GDP reading from the BEA, and while it was far below original expectations, it could be explained away as an anomaly, due to the obvious drop in goods, maybe from reduced car sales, supply chain disruptions, etc. Meaning not all is lost for the 4th qtr.

Today gives us the Bureau and Labor Statistics release of Employment Cost Index Summary. It was good news for wages since 3 months ago, with wages up 1.5%, compared to about 1% in inflation (BLS CPI). Year over year is still lagging as wages are 4.2% over last year, while inflation is 5.4% (BLS CPI) over the same period. 

It could be stated with reasonable certainty that wages are on the uptick and outpacing inflation. They will need to keep a healthy rise, as forecast for October inflation results is in the 5.7%~5.8% range. Not sure if rising wages can keep up with that pace, as the producers are pushing the additional cost downstream. That was reflected in last month's PPI report from the BLS.

Then there is the matter of the BEA's Personal Income and Outlays, September 2021. The troubling number would be the inflation adjusted disposable personal income drop of -1.6% in one month (current dollars). This is explained away as a decrease in government social benefits. This as personal income also dropped -1.0% in one month, also in current dollars. 

Personal consumption expenditures slowed from the August increase of 0.6% (chained dollars) to September's 0.3% (chained dollars).

It is that inflation adjusted -1.6% drop in disposable income that should be concerning going forward. How does that translate to continued goods and services improvement? It should be noted that a large part of the GDP improvement has been borne by the consumer, with their pct. of total GDP rising during the past 6 quarters. 

I guess time will tell, but attempts to put a positive spin on all of this will just have to wait. 


A Foray into the 2024 Presidential Election, Part XVI

Really not seeing any major shifts, although the Minnesota margin widened ever so slightly. Still too difficult to read. The unadjusted poll...