Friday, June 23, 2023

Natural Gas Inventory Report, June 23, 2023

The Energy Information Administration released their weekly report yesterday.


As always... the focus is on the Pacific Region...
Along the West Coast, prices increased this week, in line with the Henry Hub, even as consumption in California declined slightly week over week. The price at PG&E Citygate in Northern California rose 16 cents, up from $2.86/MMBtu last Wednesday to $3.02/MMBtu yesterday, while in Southern California, the price at SoCal Citygate increased more than any other major hub this week, rising $1.67 from $3.13/MMBtu last Wednesday to $4.80/MMBtu yesterday.

Select inventories of EU and UK... 

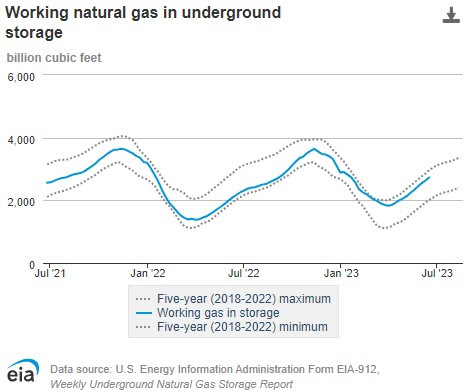
Virtually all areas continue to increase NG in storage. Despite the hysteria, NG futures continue to ease, both nearby and 12 month... on the EU and UK market, with the Henry Hub, up slightly.


A brief look at the 12 month highs for futures... TTF (EU) and UKG (UK).


Recently, I have noticed some articles stating how the EU/UK natgas prices are surging and giving many reasons. Even one that was AI generated. 

Yet these hysterical articles don't seem to hold up for very long.


Surging... compared to what?


Thursday, June 22, 2023

Gasoline consumption per latest EIA data, June 22, 2023

Gasoline prices (per AAA) eased down  from last report at $3.584, or -0.7¢. One year ago the price had ballooned to $4.955, and was on its downward trajectory... into the mid September lull, around  $3.67.

Consumption slipped -1.2% from last week, and stands 2.7% above year ago numbers. (This is a four week moving average).


The import/export surplus of gasoline since last March 1st 2022, stands at +98.7M barrels. The import/export numbers are starting to reflect pre Ukraine invasion pattern. Which was the U.S. importing in the spring- summer and exporting in the fall - winter. It generally was balanced through the year. 

Where will pump prices be next week? My estimate last week was ±5.0¢ and down -0.7¢.

Not sure that will happen this coming week, as several factors have me leaning to pump prices heading a bit lower. Again, the range may be in the ±7¢, with a downward bias. Okay, for a bold number... national average for AAA at $3.511, on next the 28th of June. 


Crude and Petroleum Product Inventories - June 22 2023

Data per the EIA weekly report.

Crude stocks fell by -3.8M barrels, from last week, and remains down -1.5% from the 5 year seasonal average. It should be noted the 5 year average includes the abnormal 2020 and 2021 number. Otherwise, the current inventory is nearly +2.9% above normal.

Distillates inventory edged up 434K barrels; and Gasoline inventories increased +479K barrels. The SPR fell another -1.719M barrels.

WTI is $69.34, compared to $68.76, one week ago, and $101.58, one year ago.

Refinery output continues to edge up on a weekly basis, as well as above year ago levels.

For anyone interested, the U.S. has exported 711M barrels of crude and petroleum products, more than imported, since March 1, 2022. It jumped 13.8M barrels this past week.

Overall, crude stocks remain quite healthy, compared to this time last year, with days supply at 28.1, compared to last year's 25.7 days.

Friday, June 16, 2023

Natural Gas Inventory Report, June 16, 2023

The Energy Information Administration released their weekly report on yesterday.


Once again, let me focus on the Pacific Region...

Along the West Coast, prices decreased this week, but remain relatively high, particularly in California. The price at PG&E Citygate in Northern California fell 86 cents, down from $3.72/MMBtu last Wednesday to $2.86/MMBtu yesterday. The price at SoCal Citygate in Southern California decreased 16 cents from $3.29/MMBtu last Wednesday to $3.13/MMBtu yesterday. Consumption of natural gas in the electric power sector in California decreased by 7% (0.1 Bcf/d) week over week, as temperatures were relatively mild. In the Sacramento Area, temperatures averaged 68°F this week, leading to 12 fewer CDDs than last week, while in the Riverside Area, inland from Los Angeles, temperatures averaged 65°F this week, leading to 1 fewer HDD and 5 fewer CDDs than last week.

Select inventories of EU and UK...


Inventories continue to improve... over historic highs for this time of year.

NatGas Price chart...

The sky is falling...


The past 2 weeks have seen sudden spikes in EU and UK futures. This is being attributed to a host of things that have been known to take place. 
  • The Dutch are shutting down the largest gas field in Europe.
  • Norway is doing maintenance on their equipment.
Nevermind where the price was just 6 weeks ago. It reminds me of the gold bug syndrome. Time to talk of gloom and doom, to unload those holdings.

Until next week. 


Thursday, June 15, 2023

6-15-23, Advance Retail Sales Report for May

Advance Monthly Sales for Retail and Food Services, May 2023.

Advance estimates of U.S. retail and food services sales for May 2023, adjusted for seasonal variation and holiday and trading-day differences, but not for price changes, were $686.6 billion, up 0.3 percent (±0.5 percent)* from the previous month, and up 1.6 percent (±0.7 percent) above May 2022. Total sales for the March 2023 through May 2023 period were up 1.7 percent (±0.4 percent) from the same period a year ago. The March 2023 to April 2023 percent change was unrevised at 0.4 percent (±0.2 percent).

The advance estimate are in current dollars, and are not adjusted for inflation. The CPI for May was 4.0% Y/Y, while the advance sales estimates were up 1.6% (± 0.7%). Effectively paying more for less. 

Retail trade sales were up 0.3 percent (±0.5 percent)* from April 2023, and up 0.7 percent (±0.5 percent) above last year. Nonstore retailers were up 6.5 percent (±1.4 percent) from last year, while food services and drinking places were up 8.0 percent (±2.3 percent) from May 2022.


Time for the revisions...


I do not fault the bean counters, as it is openly acknowledged that estimates are based on incomplete information. The problem is with the media, that jump to conclusions based on incomplete information.


In short, the sales numbers are rather stagnant, when factoring in inflation, and not really growing much when using constant dollars.

So the folks extolling the "sales" increase are  not exactly paying attention to the revised numbers, and those constantly forecasting a collapse aren't paying attention, as well. 

No news is actually good news, in this case, or at least in my humble opinion.


Wednesday, June 14, 2023

Gasoline consumption per latest EIA data, June 14, 2023

Gasoline prices (per AAA) edged up from last report at $3.591, or up +3.8¢. One year ago the price had ballooned to $5.015, which was the all time high.

Consumption increased +2.2% from last week, and stands 3.2% above year ago numbers. (This is a four week moving average).

The import/export surplus of gasoline since last March 1st 2022, stands at +99.2M barrels. The import/export numbers are starting to reflect pre Ukraine invasion pattern. Which was the U.S. importing in the spring- summer and exporting in the fall - winter. It generally was balanced through the year. 

Clearly, the upheaval has smoothed out.

Where will pump prices be next week? My estimate last week was ±5.0¢ and ended up +3.8¢.

Not sure that will happen this coming week, as several factors have me leaning to pump prices heading a bit lower. Again, the range may be in the ±5¢, with a slight downward bias. 

For fun, here is my current forecast for the remainder of the year. 


Crude and Petroleum Product Inventories - June 14 2023

Data per the EIA weekly report.

Crude stocks rose dramatically by 7.9M barrels, from last week, and remains down -1.6% from the 5 year seasonal average. It should be noted the 5 year average includes the abnormal 2020 and 2021 number. Otherwise, the current inventory is nearly +2.4% above normal.

Distillates inventory surged +2.1M barresl; and Gasoline inventories climbed +1.2M barrels barrels. The SPR fell another -1.882M barrels.

WTI is $68.76, compared to $72.56, one week ago, and $110.75, one year ago.

Refinery output continues to edge up on a weekly basis, as well as above year ago levels.

For anyone interested, the U.S. has exported 697.2 M barrels of crude and petroleum products, more than imported, since March 1, 2022. It jumped 8.5M barrels this past week.

Overall, crude stocks remain quite healthy, compared to this time last year, with days supply at 28.5, compared to last year's 25.8 days.

A Foray into the 2024 Presidential Election, Part XVI

Really not seeing any major shifts, although the Minnesota margin widened ever so slightly. Still too difficult to read. The unadjusted poll...