Showing posts with label food. Show all posts

Monday, April 15, 2024

4/15/2024, Advance Retail Sales Report for March Data

Advance Monthly Sales for Retail and Food Services, March Report.

Advance estimates of U.S. retail and food services sales for March 2024, adjusted for seasonal variation and holiday and trading-day differences, but not for price changes, were $709.6 billion, up 0.7 percent (±0.5 percent) from the previous month, and up 4.0 percent (±0.5 percent) above March 2023. Total sales for the January 2024 through March 2024 period were up 2.1 percent (±0.5 percent) from the same period a year ago. The January 2024 to February 2024 percent change was revised from up 0.6 percent (±0.5 percent) to up 0.9 percent (±0.2 percent).

Retail trade sales were up 0.8 percent (±0.5 percent) from February 2024, and up 3.6 percent (±0.5 percent) above last year. Nonstore retailers were up 11.3 percent (±1.6 percent) from last year, while food services and drinking places were up 6.5 percent (±2.1 percent) from March 2023.

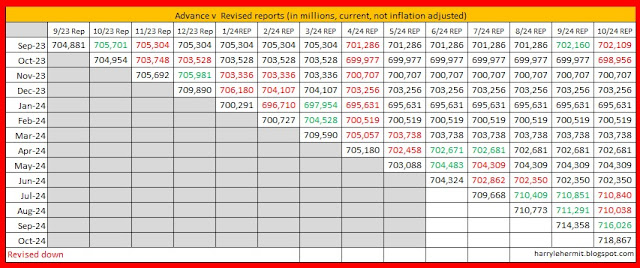
The previous two months were revised upward. Here is the revision history...


The inflation adjusted retail sales...


Taking a look at retail sales (current dollars), with inflation adjusted (real dollars Feb. 2020).

The orange dots is the inflation adjusted, the line has been consistently just below the 600,000 mark (in millions)

Another comparison would be inflation adjusted as well.

Sales when adjusted for inflation, has remained relatively flat, after the recovery from covid, and vaccine rollout, plus stimulus. The timing for this, coupled with major issues in container transportation... resulted in the transitory phase of inflation.


Quite a good argument can be made the "transitory" inflation was exported, due to ocean going shipping problems. Of course, by mid to late 2021, energy became a predominant factor, followed by the Russian invasion of Ukraine and subsequent energy issues. By that time, inflation became everywhere.

This month's report was pretty darn stellar, given the upward revisions of the previous two months. The standout was electronic shopping and mail order houses, which account for 17.3% of the total, but was a 45.4% of the overall annual gains, with the monthly rise being 64.7% of the total monthly gain.

There are problem areas, however. 

But we can take a good report, without muddying up the picture. At least in my humble opinion.

Thursday, April 11, 2024

PPI APR. 2024 release March 2024 Data

The BLS has released the March, 2024 Producer Price Index Report (historical releases)

The Producer Price Index for final demand rose 0.2 percent in March, seasonally adjusted, the U.S. Bureau of Labor Statistics reported today. Final demand prices moved up 0.6 percent in February and 0.4 percent in January. (See table A.) On an unadjusted basis, the index for final demand increased 2.1 percent for the 12 months ended in March, the largest advance since rising 2.3 percent for the 12 months ended April 2023.

The March increase in the index for final demand is attributable to a 0.3-percent rise in prices for final demand services. In contrast, the index for final demand goods edged down 0.1 percent.

The index for final demand less foods, energy, and trade services moved up 0.2 percent in March after rising 0.3 percent in February. For the 12 months ended in March, prices for final demand less foods, energy, and trade services increased 2.8 percent.

Now for a graph and chart...


As stated, the 2.1% is the highest final demand number since April 2023. There seems to be some quibbling over that number, as related to gasoline prices. I should point out the "preliminary" tag on many items. So we can expect some more adjustments in those months.

I have read where the final demand would have been 2.4%, had the gasoline been correctly attributed. I don't think the annual would have seen that. However, the monthly figure is indeed laughable, and should have been near last month's figure.. 

The final demand is creeping up, which is troubling. Even more troubling is the final demand for food, which popped a healthy +0.8% on the month, which follows +1.1% for the previous month. Chew on that for awhile.


Thursday, March 14, 2024

PPI Mar. 2024 release February 2024 Data

The BLS has released the February, 2024 Producer Price Index Report (historical releases)

The Producer Price Index for final demand rose 0.6 percent in February, seasonally adjusted, the U.S. Bureau of Labor Statistics reported today. Final demand prices increased 0.3 percent in January and edged down 0.1 percent in December 2023. (See table A.) On an unadjusted basis, the final demand index advanced 1.6 percent for the 12 months ended in February, the largest rise since moving up 1.8 percent for the 12 months ended September 2023.

In February, nearly two-thirds of the rise in final demand prices can be traced to the index for final demand goods, which advanced 1.2 percent. Prices for final demand services moved up 0.3 percent.

The index for final demand less foods, energy, and trade services increased 0.4 percent in February after rising 0.6 percent in January. For the 12 months ended in February, prices for final demand less foods, energy, and trade services moved up 2.8 percent.

Current graph with revisions...

Then there is this chart, which briefly compares the category to previous month's annual rate.


So the report was deemed as troubling, as it will be passed on to the consumer. No doubt inflation is not down to the level sought, but not a rapid acceleration. More of tepid acceleration in my opinion.


3/14/2024, Advance Retail Sales Report for February Data

Advance Monthly Sales for Retail and Food Services, February Report.

Advance estimates of U.S. retail and food services sales for February 2024, adjusted for seasonal variation and holiday and trading-day differences, but not for price changes, were $700.7 billion, up 0.6 percent (±0.5 percent) from the previous month, and up 1.5 percent (±0.7 percent) above February 2023. Total sales for the December 2023 through February 2024 period were up 2.1 percent (±0.5 percent) from the same period a year ago. The December 2023 to January 2024 percent change was revised from down 0.8 percent (±0.5 percent) to down 1.1 percent (±0.4 percent).

Of course the previous 2 months were revised downward...


The result in inflation adjusted sales, looked like this...


Since the pre-covid timing, the inflation report...

The average for the monthly sales starting from March 2021...


The trend is undeniably downward. 

It's not all gloom and doom, as there are areas seemingly on the uptick. Read the report and download the data, to see those areas.


Friday, February 16, 2024

PPI Feb. 2024 release January 2024 Data

The BLS has released the January, 2024 Producer Price Index Report (historical releases) 

Final demand services: The index for final demand services moved up 0.6 percent in January, the largest increase since rising 0.8 percent in July 2023. In January, most of the advance is attributable to prices for final demand services less trade, transportation, and warehousing, which climbed 0.8 percent. The index for final demand trade services moved up 0.2 percent. (Trade indexes measure changes in margins received by wholesalers and retailers.) Conversely, prices for final demand transportation and warehousing services fell 0.4 percent. 

Product detail: A 2.2-percent increase in the index for hospital outpatient care was a major factor in the January rise in prices for final demand services. The indexes for chemicals and allied products wholesaling, machinery and equipment wholesaling, portfolio management, traveler accommodation services, and legal services also moved higher. In contrast, prices for long-distance motor carrying decreased 1.0 percent. The indexes for computer hardware, software, and supplies retailing and for engineering services also moved lower. (See table 2.)

I emphasized a specfic portion. after much jockeying with revisions of numbers in the medical category over the past year... those have come to and end. So after all these revision helped tamp down inflation numbers, those days are over.


The headlines have focused on how the PPI report came in hotter than expected. I wonder if the expectations are real or some hope of immediate relief in those interest rates. It is coming, just not tomorrow. 

Thursday, February 15, 2024

2/15/2024, Advance Retail Sales Report for January Data

Advance Monthly Sales for Retail and Food Services, January Report.

Advance estimates of U.S. retail and food services sales for January 2024, adjusted for seasonal variation and holiday and trading-day differences, but not for price changes, were $700.3 billion, down 0.8 percent (±0.5 percent) from the previous month, and up 0.6 percent (±0.7 percent)* above January 2023. Total sales for the November 2023 through January 2024 period were up 3.1 percent (±0.5 percent) from the same period a year ago. The November 2023 to December 2023 percent change was revised from up 0.6 percent (±0.5 percent) to up 0.4 percent (±0.3 percent).

Cutting through the malarkey...


After revising the November numbers down by -0.4%, and December numbers downward by -1.4%, we still end up with January sales down by -0.8%, from December.  With inflation for the past 12 months at 3.1%, sales were only up +0.6%.


Granted the graph above, is a bit busy, but the retail sales, adjusted for inflation appear to be flat.

Looking at the average monthly sales (adjusted for inflation) since March, 2021... is provided in this graph.


Even better is this inflation adjusted graph starting in February, 2020.


Once past the initial vaccine rollout, coupled with massive stimulus checks, it quickly petered out, then rising into early 2022, then early 2023 saw a slow and steady decline.

As for the data in the report, there was a striking difference between adjusted and unadjusted numbers.

The unadjusted numbers were across the board for monthly sales, with adjusted showing only a very few instances of sales increases... with neither being inflation adjusted. 

When checking individual categories for adjusted numbers, and factoring inflation... only 3 indicated any improvement. 
  • Furniture and home furnishings
  • Grocery stores (just barely)
  • Food services and drinking places.
No doubt next month's report will be stellar, once all the downward revision from previous months take place. (LOL!)

Wednesday, January 17, 2024

1/17/2024, Advance Retail Sales Report for December Data

Advance Monthly Sales for Retail and Food Services, December Report.

Advance estimates of U.S. retail and food services sales for December 2023, adjusted for seasonal variation and holiday and trading-day differences, but not for price changes, were $709.9 billion, up 0.6 percent (±0.5 percent) from the previous month, and up 5.6 percent (±0.7 percent) above December 2022. Total sales for the 12 months of 2023 were up 3.2 percent (±0.4 percent) from 2022. Total sales for the October 2023 through December 2023 period were up 3.9 percent (±0.4 percent) from the same period a year ago. The October 2023 to November 2023 percent change was unrevised from up 0.3 percent (±0.3 percent)*.

Hmmm...  "Total sales for the 12 months of 2023 were up 3.2 percent (±0.4 percent) from 2022." The BLS listed that same period as having inflation of 3.4%. Which means the seasonal variation and trading-day differences have come into the equation. Otherwise, sales were up a bit more than indicated, imho.

First up the revisions...


We continue a pattern of previous months being revised downward, so the monthly changes are somewhat suspect.

When adjusted for inflation, the annual shows an improvement of +2.2%. The January numbers will be quite interesting, imho. The January report, adjusted for inflation, is slightly above the December number with inflation adjustements. Revisions will likely take place. 😒

The inflation adjusted chart looks like this...


The quantity of goods has not yet matched the highs of both March and April of 2021 and 2022. It will be interesting to see if a seasonal repeat is in store for early spring.

Mail order, vehicles and general merchandise led the way, with $4.305M of the $3.909M increase. That means there were some losers. Gasoline was down -$691M. The rest were slightly above or slightly below.

Seasonal factors likely drove the mail order and general merchandise, so can't reasonably expect a repeat in January. Gasoline currently remains relatively flat, compared to December.

Like I said... the revisions for January's report should be very interesting.

Friday, January 12, 2024

Producer Price Index January release December 2023 Data

The BLS has released the December Producer Price Index Report (historical releases)

The Producer Price Index for final demand fell 0.1 percent in December, seasonally adjusted, the U.S. Bureau of Labor Statistics reported today. Final demand prices moved down 0.1 percent in November and 0.4 percent in October. (See table A.) On an unadjusted basis, the index for final demand rose 1.0 percent in 2023 after increasing 6.4 percent in 2022.

If the PPI is really a forerunner of consumer inflation, then CPI should continue to ease, as PPI has nearing same rate as CPI in the periods outlined below.


I would hope the drops in food and energy will continue, or at least stabilize. I suspect energy will creep up in the coming months, as this is a seasonal lull, according to previous December reports. Those same reports suggest a seasonal lull for foods.

I guess it is important to find the good news and celebrate... however fleeting it might be.

Thursday, December 14, 2023

12-15-23, Advance Retail Sales Report for November Data

Advance Monthly Sales for Retail and Food Services, November Report.

First up should be the revisions...


Note the -0.2% downward revision in October's numbers and as always, remember this data is NOT inflation adjusted. Now onto the current report...
Advance estimates of U.S. retail and food services sales for November 2023, adjusted for seasonal variation and holiday and trading-day differences, but not for price changes, were $705.7 billion, up 0.3 percent (±0.5 percent)* from the previous month, and up 4.1 percent (±0.7 percent) above November 2022.

The inflation adjusted chart looks like this...


It is hard to capture from the graph, but "Real" sales are advancing very slowly since January, although still below 2022 average levels. Year over year, up +0.8% inflation adjusted, with the month being up +0.5% after inflation adjustements. 

So it can be called a win.


Wednesday, December 13, 2023

Producer Price Index December release November 2023 Data

The BLS has released the November Producer Price Index Report (historical releases)

The Producer Price Index for final demand was unchanged in November, seasonally adjusted, the U.S. Bureau of Labor Statistics reported today. Final demand prices decreased 0.4 percent in October and rose 0.4 percent in September. (See table A.) On an unadjusted basis, the index for final demand increased 0.9 percent for the 12 months ended in November.

In November, the indexes for both final demand goods and for final demand services were unchanged. 


Final demand goods: The index for final demand goods was unchanged in November after dropping 1.4 percent in October. In November, price increases of 0.6 percent for final demand foods and 0.2 percent for final demand goods less foods and energy offset a 1.2-percent decrease in the index for final demand energy.

Let's revisit that paragraph. What did the -1.2% decrease in the index for final demand energy... offset?

Within final demand goods in November, prices for chicken eggs jumped 58.8 percent. The indexes for fresh fruits and melons, utility natural gas, electric power, and carbon steel scrap also moved higher. In contrast, prices for gasoline fell 4.1 percent.

So gasoline (-4.1%), which is typically moving into seasonal lows, is the reason for that -1.2% decrease, which offsets a bunch of rises in food (+0.6%) and other energy components. 

Not to nitpick, but if gasoline is having that impact, and is moving into seasonal lows, which might continue through the December release... could reverse beginning after Christmas, just like last year.

For those of us that like to eat food, that annualized 7.2% increase in food is going to weigh on the budget of many of us, unless we decide to eat less and lose "weight".

Tuesday, October 17, 2023

10-17-23, Advance Retail Sales Report for September Data

Advance Monthly Sales for Retail and Food Services, September 2023

Advance estimates of U.S. retail and food services sales for September 2023, adjusted for seasonal variation and holiday and trading-day differences, but not for price changes, were $704.9 billion, up 0.7 percent (±0.5 percent) from the previous month, and up 3.8 percent (±0.7 percent) above September 2022. Total sales for the July 2023 through September 2023 period were up 3.1 percent (±0.4 percent) from the same period a year ago. The July 2023 to August 2023 percent change was revised from up 0.6 percent (±0.5 percent) to up 0.8 percent (±0.1 percent).

Retail trade sales were up 0.7 percent (±0.5 percent) from August 2023, and up 3.0 percent (±0.5 percent) above last year. Nonstore retailers were up 8.4 percent (±1.6 percent) from last year, while food services and drinking places were up 9.2 percent (±2.3 percent) from September 2022.

As always, a reminder... "not for price changes", means not adjusted for inflation.


The term "resilient" continues to be overused, when clearly the actual "stuff" being bought is rather stagnant. 

That's not to say that last month's data was not an improvement, as both month to month and year over year were up... after adjusting for inflation. However, a rolling 12 month average indicates slippage of -0.1%, when adjusted for inflation.

That includes last September, which got revised downward... ever so slightly.


It should be noted, that today's report is +1.8% above January in current dollars, yet -1.1% when inflation adjusted. THAT is after all the revisions to January. Which begs the question... what will next month's backward revisions be.

You won't hear about it, as the mantra... "if it can't be spinned positively, ignore it." I am not saying the Census Bureau minions are at work here, but politicians and their friendly media darlings do.

I will continue to monitor thee monthly reports, however this is the last in this series.

Wednesday, October 11, 2023

Producer Price Index October release with September 2023 Data

The BLS has released the September Producer Price Index Report (historical releases) 

The Producer Price Index for final demand increased 0.5 percent in September, seasonally adjusted, the U.S. Bureau of Labor Statistics reported today. Final demand prices rose 0.7 percent in August and 0.6 percent in July. (See table A.) On an unadjusted basis, the index for final demand advanced 2.2 percent for the 12 months ended in September, the largest increase since moving up 2.3 percent for the 12 months ended in April. 

Leading the increase in the final demand index in September, prices for final demand goods rose 0.9 percent. The index for final demand services advanced 0.3 percent.

Prices for final demand less foods, energy, and trade services increased 0.2 percent in September, the fourth consecutive advance. For the 12 months ended in September, the index for final demand less foods, energy, and trade services moved up 2.8 percent.


As is often the case... there were revisions to previous month's data, so don't be surprised if this month's data is revised next month. The size of July's data was a bit surprising however. When that data came out, it was considered above expectations at +0.3%. A couple of month's later, it was revised to +0.6%, without any discussion.


In any case, I will continue to track, but this should wrap up publishing my thoughts.


Thursday, September 14, 2023

9-14-23, Advance Retail Sales Report for August Data

Advance Monthly Sales for Retail and Food Services, August 2023

Advance estimates of U.S. retail and food services sales for August 2023, adjusted for seasonal variation and holiday and trading-day differences, but not for price changes, were $697.6 billion, up 0.6 percent (±0.5 percent) from the previous month, and up 2.5 percent (±0.7 percent) above August 2022. Total sales for the June 2023 through August 2023 period were up 2.2 percent (±0.4 percent) from the same period a year ago. The June 2023 to July 2023 percent change was revised from up 0.7 percent (±0.5 percent) to up 0.5 percent (±0.2 percent).

Retail trade sales were up 0.6 percent (±0.5 percent) from July 2023, and up 1.6 percent (±0.5 percent) above last year. Gasoline stations were down 10.3 percent (±1.1 percent) from last year, while food services and drinking places were up 8.5 percent (±2.3 percent) from August 2022.

Again... "not for price changes", means not adjusted for inflation.


Much is being made of "gasoline's" impact, but the numbers, when adjusted for inflation continue to remain rather stagnant, with adjusted spending remaining rather flat since the roll out of the vaccines and that $1,400 stimulus in spring 2021. Which also coincides with the ramp up of inflation.


Last month, my mood was elevated, as previous month's data had been revised upward, after so many months of downward revisions. 

We seem to be at it again. Can I expect this month's numbers to be revised downward... next month? Revising a previous month downward, then claiming +0.6% increase, while then stating it is mostly gasoline, is befuddling to me. 

Somehow, I expect the cycle to continue, without anyone questioning those banner numbers. 

Producer Price Index September release with August 2023 Data

The BLS has released the July Producer Price Index Report (historical releases) 

The Producer Price Index for final demand increased 0.7 percent in August, seasonally adjusted, after rising 0.4 percent in July, the U.S. Bureau of Labor Statistics reported today. (See table A.) The August advance is the largest increase in final demand prices since moving up 0.9 percent in June 2022. On an unadjusted basis, the index for final demand rose 1.6 percent for the 12 months ended in August.

In August, 80 percent of the rise in final demand prices is attributable to a 2.0-percent jump in the index for final demand goods. Prices for final demand services advanced 0.2 percent.

The index for final demand less foods, energy, and trade services increased 0.3 percent in August, the same as in July. For the 12 months ended in August, prices for final demand less foods, energy, and trade services rose 3.0 percent, the largest advance since moving up 3.4 percent for the 12 months ended in April.


So, the story is about gasoline prices creating most of the PPI. This might be true, but the current forecast is up and not down for that commodity.


Everything is screaming some future relief, except for what drove the August PPI higher. September is shaping up as a repeat of August, imho.


Not the most scientific metric, but there is more pink than last month. Not saying inflation is about to accelerate, but not so sure that crude oil will taper off its current rise. And we should remember that yesterday's CPI report mentioned the impact of gasoline, but also indicated that energy prices were down compared to one year ago... current at 294.328, year ago at 305.372. Gasoline current... 336.979, year ago at 348.593.

So, if last month's PPI was impacted by energy and thereby distorting the number, then energy being cheaper this year than last... would indicate the YoY 1.6% is also distorted. In fact the release indicates the PPI excluding energy was 2.0%. 

That is not a bad number, imho. Things are indeed looking up... except for pump prices, which are also looking up, but not in a good way.

Tuesday, August 15, 2023

8-15-23, Advance Retail Sales Report for July

Advance Monthly Sales for Retail and Food Services, July 2023

Advance estimates of U.S. retail and food services sales for July 2023, adjusted for seasonal variation and holiday and trading-day differences, but not for price changes, were $696.4 billion, up 0.7 percent (±0.5 percent) from the previous month, and up 3.2 percent (±0.7 percent) above July 2022. Total sales for the May 2023 through July 2023 period were up 2.3 percent (±0.4 percent) from the same period a year ago. The May 2023 to June 2023 percent change was revised from up 0.2 percent (±0.5 percent)* to up 0.3 percent (±0.2 percent).

Retail trade sales were up 0.6 percent (±0.5 percent) from June 2023, and up 2.0 percent (±0.5 percent) above last year. Nonstore retailers were up 10.3 percent (±1.6 percent) from last year, while food services and drinking places were up 11.9 percent (±2.3 percent) from July 2022.

The "but not for price changes, means not adjusted for inflation... 


While improved over last month by 0.5% when adjusted for inflation... year to year is flat.


In a previous column, I made mention of the Census Bureau's propensity to revise downward previous month's data to improve current month results. We are in the second month of previous month's data being revised upward... which is good news. May that become a trend going forward.

Non store retailers, continues to lead the pack, with Furniture and Electronics turning negative from last month. Clothing edged up from last month, with Food Services and drinking places accelerating.

What really stands out is the EX gasoline category, which rose 5.8% year over year, which is better than the CPI EX gasoline of 4.3%.

Room for optimism!


Friday, August 11, 2023

Producer Price Index August 2023 release

The BLS has released the July Producer Price Index Report (historical releases) 

The Producer Price Index for final demand increased 0.3 percent in July, seasonally adjusted, the U.S. Bureau of Labor Statistics reported today. Final demand prices were unchanged in June and declined 0.3 percent in May. (See table A.) On an unadjusted basis, the index for final demand advanced 0.8 percent for the 12 months ended in July. 

In July, the increase in final demand prices was led by a 0.5-percent rise in the index for final demand services. Prices for final demand goods edged up 0.1 percent.

The rate of increases has somewhat slowed and selected areas are now trending downward. The PPI since start of Covid has risen 17.3%, compared to the CPI rise of 19.2%. (That is just two data points and should not be construed as any indication of some guaranteed future changes.)

Certainly improvement, but overall a "D" rating as for inflation outlook, imho. August would appear to have a further inflation uptick, from July's reports. 


Tuesday, July 18, 2023

7-18-23, Advance Retail Sales Report for June

Advance Monthly Sales for Retail and Food Services, June 2023

Advance estimates of U.S. retail and food services sales for June 2023, adjusted for seasonal variation and holiday and trading-day differences, but not for price changes, were $689.5 billion, up 0.2 percent (±0.5 percent)* from the previous month, and up 1.5 percent (±0.7 percent) above June 2022. Total sales for the April 2023 through June 2023 period were up 1.6 percent (±0.4 percent) from the same period a year ago. The April 2023 to May 2023 percent change was revised from up 0.3 percent (±0.5 percent)* to up 0.5 percent (±0.2 percent).

Retail trade sales were up 0.2 percent (±0.5 percent)* from May 2023, and up 0.5 percent (±0.5 percent)* above last year. Nonstore retailers were up 9.4 percent (±1.6 percent) from last year, while food services and drinking places were up 8.4 percent (±2.3 percent) from June 2022.

Those figures are nominal, meaning not adjusted for inflation. Compare the nominal 0.2% monthly and 1.5% annual increase... to the CPI of 0.2% monthly and 3.0% annual. In other word, the montly was flat in inflation adjusted and -1.5% on the annual inflation adjusted.


Now for the good news... maybe.
After months of the media extolling the upward trend meeting or exceeding expectations of the Advance report, they are ho-hum to disappointed in this report.

For months, I have lamented the constant downward revisions of preceding months, which gives the appearance of meeting or exceeding expectations on the Advance Report.

However, this month's advance report shows an upward revision to both April and May... from last month. Without the upward in revision in May's numbers, the uptick would have been about +0.43%. Which is still below the expectations, but not as far below the +0.5% expected.

What does appear to be happening... is the consumer is running out of steam, and has been since January. Even the FED has picked up on this. The Census Bureau acknowledges this with their XLS download (table 2). 


Now the winners and losers...
Nonstore retailers is generally the mail order places, such as Amazon, etc. Furniture and electronics popped up as well as clothing. 

Building materials, gasoline stations, sporting goods, and surprisingly... grocery stores slid.

As stated earlier, the spending habits are simply shifting from one thing to another, with no real growth... except inflation generated.

This graph is from data taken from the St. Louis Federal Reserve (FRED) website...
Seriously, the data from every source... indicates the party is pretty much over. It will be hard to put any type of positive spin... going forward. 

Spin has been most of the business news for over a year. The realization of this condition will lead to claims of gloom and doom... which is also spin. 

The past two years have not been nirvana and the outlook going forward is not bleak. At some point the spin will moderate to reality, imho.

Thursday, July 13, 2023

Producer Price Index July 2023 release for June Data.

The BLS has released the June Producer Price Index Report (historical releases) 

The Producer Price Index for final demand increased 0.1 percent in June, seasonally adjusted, the U.S. Bureau of Labor Statistics reported today. Final demand prices declined 0.4 percent in May and edged up 0.1 percent in April. (See table A.) On an unadjusted basis, the index for final demand advanced 0.1 percent for the 12 months ended in June. 

In June, the increase in final demand prices can be traced to a 0.2-percent rise in the index for final demand services. Prices for final demand goods were unchanged.

The index for final demand less foods, energy, and trade services moved up 0.1 percent in June after no change in May. For the 12 months ended in June, prices for final demand less foods, energy, and trade services advanced 2.6 percent.


The rate of increases has slowed and selected areas are now trending downward. The PPI since start of Covid has risen 17.8%, compared to the CPI rise of 18.3%. (That is just two data points and should not be construed as any indication of some guaranteed future changes.)

The downward trend continues...

Except...

The attention is now shifting to "services"..

Even this will likely resume falling by next month, as it is an annual rate. The montly stood flat, after two months of gains.

Still, a good report... IF the trend continues.

Review of March 2024 data, 1Q GDP, PCE and personal income

The monthly summary is not so wonderful, incomparison... Inside all that pink is some troubling food related issues. Even though energy is s...