Showing posts with label food. Show all posts

Thursday, June 15, 2023

6-15-23, Advance Retail Sales Report for May

Advance Monthly Sales for Retail and Food Services, May 2023.

Advance estimates of U.S. retail and food services sales for May 2023, adjusted for seasonal variation and holiday and trading-day differences, but not for price changes, were $686.6 billion, up 0.3 percent (±0.5 percent)* from the previous month, and up 1.6 percent (±0.7 percent) above May 2022. Total sales for the March 2023 through May 2023 period were up 1.7 percent (±0.4 percent) from the same period a year ago. The March 2023 to April 2023 percent change was unrevised at 0.4 percent (±0.2 percent).

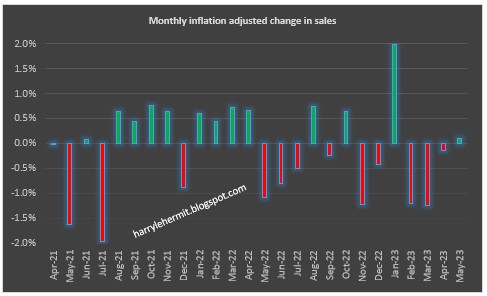
The advance estimate are in current dollars, and are not adjusted for inflation. The CPI for May was 4.0% Y/Y, while the advance sales estimates were up 1.6% (± 0.7%). Effectively paying more for less. 

Retail trade sales were up 0.3 percent (±0.5 percent)* from April 2023, and up 0.7 percent (±0.5 percent) above last year. Nonstore retailers were up 6.5 percent (±1.4 percent) from last year, while food services and drinking places were up 8.0 percent (±2.3 percent) from May 2022.


Time for the revisions...


I do not fault the bean counters, as it is openly acknowledged that estimates are based on incomplete information. The problem is with the media, that jump to conclusions based on incomplete information.


In short, the sales numbers are rather stagnant, when factoring in inflation, and not really growing much when using constant dollars.

So the folks extolling the "sales" increase are  not exactly paying attention to the revised numbers, and those constantly forecasting a collapse aren't paying attention, as well. 

No news is actually good news, in this case, or at least in my humble opinion.


Wednesday, June 14, 2023

Producer Price Index June 2023 release for May Data.

The BLS has released the April Producer Price Index Report (historical releases)

The Producer Price Index for final demand declined 0.3 percent in May, seasonally adjusted, the U.S. Bureau of Labor Statistics reported today. Final demand prices rose 0.2 percent in April and fell 0.4 percent in March. On an unadjusted basis, the index for final demand moved up 1.1 percent for the 12 months ended in May.

In May, the decline in the final demand index can be traced to prices for final demand goods, which fell 1.6 percent. The index for final demand services increased 0.2 percent. 

Prices for final demand less foods, energy, and trade services were unchanged in May after inching up 0.1 percent in April. For the 12 months ended in May, the index for final demand less foods, energy, and trade services increased 2.8 percent. 

Overall, the trend is downward and some relief might be in sight for the consumer.

The decreased costs in unprocessed intermediate, have not completely moved into the processed area. Possibly by next month? 
Unprocessed goods for intermediate demand: The index for unprocessed goods for intermediate demand fell 4.8 percent in May after increasing 1.6 percent in April. Almost 60 percent of the broad- based decrease is attributable to a 7.8-percent drop in prices for unprocessed energy materials
Nearly 60 percent of the May decline in the index for unprocessed goods for 
intermediate demand can be traced to prices for crude petroleum, which fell 10.2 percent.
The price drops all across the petroleum sector are evident in the report. Another big drop should be forthcoming in the report for June, as this sector peaked last June. 

After that, the impact of petroleum will decrease and the focus will shift elsewhere. As the saying goes... the low hanging fruit will have been picked by fall. 

When looking at the overall, as in the first graph and seeing it hold relatively steady, then realizing the significant drops in energy... sticky it is.

Tuesday, May 16, 2023

5-16-23, Advance Retail Sales Report for April

Advance Monthly Sales for Retail and Food Services, April 2023.

Advance estimates of U.S. retail and food services sales for April 2023, adjusted for seasonal variation and holiday and trading-day differences, but not for price changes, were $686.1 billion, up 0.4 percent (±0.5 percent)* from the previous month, and up 1.6 percent (±0.7 percent) above April 2022. Total sales for the February 2023 through April 2023 period were up 3.1 percent (±0.4 percent) from the same period a year ago. The February 2023 to March 2023 percent change was revised from down 0.6 percent (±0.5 percent) to down 0.7 percent (±0.2 percent).

Retail trade sales were up 0.4 percent (±0.5 percent)* from March 2023, and up 0.5 percent (±0.5 percent)* above last year. Nonstore retailers were up 8.0 percent (±1.2 percent) from last year, while food services and drinking places were up 9.4 percent (±2.5 percent) from April 2022.

As always, these figures are not adjusted for inflation, so +1.6% above year ago levels, when inflation adjusted comes down to something like -3.2%.

Now for those revisions. Yes, April was up 0.4% from previous month, which was revised from -0.6% to -0.7%. Doesn't seem bad, until you look at the previous month's revisions.

The revisions for January, February, March were sizable. So after those sizable revisions... you do end up with -0.7% for the previous month. 

We seem to be on a trend of downward revisions, and then extolling the current report. I suspect this month will be revised downward for next month... so next month can seem like a positive. 

So, I do not have a positive spin on this report.

As has been the case for several months, the "quantity" has remained stagnant, while spending increases. 

Adjusting for inflation, the actual volume of sales has remained rather flat for the past two years. 

There were winners and losers, but the revisions really distorted previous lists of winners and losers... such that I cannot attempt a realistic review. (Mostly laziness)!


Thursday, May 11, 2023

Producer Price Index May 2023 release for April Data.

The BLS has released the April Producer Price Index Report (historical releases)

The Producer Price Index for final demand advanced 0.2 percent in April, seasonally adjusted, the U.S. Bureau of Labor Statistics reported today. Final demand prices fell 0.4 percent in March and were unchanged in February. On an unadjusted basis, the index for final demand moved up 2.3 percent for the 12 months ended in April. 

In April, 80 percent of the rise in the index for final demand is attributable to a 0.3-percent increase in prices for final demand services. The index for final demand goods advanced 0.2 percent.

Prices for final demand less foods, energy, and trade services rose 0.2 percent in April after inching up 0.1 percent in March. For the 12 months ended in April, the index for final demand less foods, energy, and trade services increased 3.4 percent.

Certainly, the PPI increases have slowed, but not sure all has been reflected in the CPI. Historically, the CPI is has risen slightly faster that PPI, yet the past 3 years has seen the PPI outdistance the CPI. This is reflected in the following graph.

The chart indicates the comparison of that 39 month period, compared to the preceding 109 months.

Reverting to normal requires a negative PPI and/or continued inflation for the next few months. 

It will take most of the year, before normal takes places, imho. 

Friday, April 14, 2023

4-14-23, Advance Retail Sales Report for March

Advance Monthly Sales for Retail and Food Services, March 2023

Advance estimates of U.S. retail and food services sales for March 2023, adjusted for seasonal variation and holiday and trading-day differences, but not for price changes, were $691.7 billion, down 1.0 percent (±0.5 percent) from the previous month, but up 2.9 percent (±0.7 percent) above March 2022. Total sales for the January 2023 through March 2023 period were up 5.4 percent (±0.4 percent) from the same period a year ago. The January 2023 to February 2023 percent change was revised from down 0.4 percent (±0.5 percent)* to down 0.2 percent (±0.1 percent).

Retail trade sales were down 1.2 percent (±0.5 percent) from February 2023, but up 1.5 percent (±0.5 percent) above last year. Nonstore retailers were up 12.3 percent (±1.2 percent) from last year, while food services and drinking places were up 13.0 percent (±2.6 percent) from March 2022.

The data is not inflation adjusted. The data in this graph is...

Plain and simple... the quantity goods being bought, has remained rather flat for several months. Inflation has made for the increases.

but up 2.9 percent (±0.7 percent) above March 2022

Again, that is before inflation is taken in consideration. The CPI-U, was 5.0%. And the M/M CPI-U was +0.1% seasonally adjusted. 

For the month to month, with inflation adjustments... 

Its not really bad news, as nothing as fallen off a cliff. With this being tax refund season... it should remain stable for a while longer.

It does appear that home renovation, appliances, and electronic items have somewhat paused. Restaurant and bars, seemed to slip last month, with groceries edging up. On the year to year, groceries are still down and the restaurant and bar category is running ahead.

I was confused over the m/m drop in gasoline and service stations, but suspect that is more to do with "seasonal" adjustments, rather than reality. But it may be we are not going into the convenient store for a snack and rather stopping at a drive thru restaurant.

The whole point being... sales were up, but stuff bought actually slipped -1.3% on the month and -1.9% on the year. 

It is too early to predict the sky is falling. I suspect some turnaround with the aforementioned tax refund season upon us. 

The oddity to me, is the difference in nominal sales from February 2020, to current. Sales have increased a whopping +31.5% during an inflationary period of 17.7%. That leaves 13.8% coming from somewhere. 

I keep coming back to the various simulus packages and the so called multipler effect. Which then leads me to wonder, when will it end. I suspect we are getting closer.

That is not to say, we are going to fall off a cliff, but rather some contraction in the economy, is likely.

Thursday, April 13, 2023

Producer Price Index Apr 2023 release for March Data.

The BLS has released the March Producer Price Index Report (historical releases)

The Producer Price Index for final demand declined 0.5 percent in March, seasonally adjusted, the U.S. Bureau of Labor Statistics reported today. Final demand prices were unchanged in February and increased 0.4 percent in January. (See table A.) On an unadjusted basis, the index for final demand advanced 2.7 percent for the 12 months ended in March. 

In March, two-thirds of the decline in the index for final demand can be attributed to a 1.0-percent decrease in prices for final demand goods. The index for final demand services moved down 0.3 percent.

Prices for final demand less foods, energy, and trade services edged up 0.1 percent in March after rising 0.2 percent in February. For the 12 months ended in March, the index for final demand less foods, energy, and trade services increased 3.6 percent.

Last month's projection...

Still, I would anticipate March to be year over year of +3.0%, and month to month being flat. 

Not too bad for a complete idiot.

Now for my version of spin, or misdirection, or whatever. I tend to look for things that impact me, so my version... may not match your version.

Off the top, the energy index was almost 3/4 of that -0.5% m/m decline in final demand. While most everyone thinks of gasoline, it did rise in March and will continue to do so... maybe through May. It will not achieve last year's June highs, in my opinion. 

The story in energy is natural gas. This will show declines into the summer. I don't think it will achieve last summer's high, but it might come close. The upshot being a continuation of m/m declines and annual rates declining into that period.

Currently the PPI final demand number is sitting at 20.8% above the April, 2020 low. The CPI, for reference, is 17.7% above that same period. I would not project any significant correlation between those two figures.

March's number, per the PPIFIS, stands at 140.865, compared to last June's 140.156. It is still +0.5% from June. Clearly, the y/y will continue to decline, but how far will it decline?

Being someone that consumes food on a regular basis, I should point out the final demand on food was +0.6% m/m. That is stark contrast from yesterday's CPI "food at home", at -0.3%. That concerns me more than the rise in current pump prices. 

My review of the PPI data, leads me to believe the (core) sticky prices are stuck in the near term. The year over year, however, will continue to fall. At some part, core will also begin to slip.

Next month will likely show another -0.2% m/m, and a +2.0% y/y. No doubt the y/y will likely turn negative in the next few months, largely due to energy. At some point in the summer, the sticky core will have to pitch in, to keep the numbers in decline.

BUT, if that occurs, is it due to slowing demand?

Smarter minds will have to weigh in on that question.

Wednesday, March 15, 2023

The February Advance Retail Sales Report

ADVANCE MONTHLY SALES FOR RETAIL AND FOOD SERVICES, February 2023 

Advance estimates of U.S. retail and food services sales for February 2023, adjusted for seasonal variation and holiday and trading-day differences, but not for price changes, were $697.9 billion, down 0.4 percent (±0.5 percent)* from the previous month, but up 5.4 percent (±0.7 percent) above February 2022. Total sales for the December 2022 through February 2023 period were up 6.4 percent (±0.4 percent) from the same period a year ago. The December 2022 to January 2023 percent change was revised from up 3.0 percent (±0.5 percent) to up 3.2 percent (±0.3 percent).

Retail trade sales were down 0.1 percent (±0.5 percent)* from January 2023, but up 4.0 percent (±0.7 percent) above last year. Food services and drinking places were up 15.3 percent (±2.6 percent) from February 2022, while general merchandise stores were up 10.5 percent (±0.2 percent) from last year.

The data is not inflation adjusted. The data in this graph is...

Click image to enlarge
Plain and simple... the quantity goods being bought, remained rather flat for several month. Inflation has made for the increases in cost.
but up 5.4 percent (±0.7 percent) above February 2022.

Again, that is before inflation is taken in consideration. The CPI-U, was 6.0%. 

For the month to month, with inflation adjustments...

Click image to enlarge
It hasn't fallen off a cliff, but it hasn't really grown. The growth is mostly due to inflation. 
Click image to enlarge
Adjusting for inflation, the above chart lists the only groupings that did not slip last month.

Not sure what to make of the data, to calculate going forward. Will find out next month!!


The BLS has released the February Producer Price Index Report. (historical releases)

The BLS has released the February Producer Price Index Report. (historical releases)

The Producer Price Index for Final Demand decreased 0.1 percent in February, seasonally adjusted, the U.S. Bureau of Labor Statistics reported today. Final demand prices advanced 0.3 percent in January and declined 0.2 percent in December 2022. (See table A.) On an unadjusted basis, the final demand index rose 4.6 percent for the 12 months ended in February.

In February, the decline in the final demand index was led by prices for final demand goods, which fell 0.2 percent. The index for final demand services edged down 0.1 percent.

The index for final demand less foods, energy, and trade services increased 0.2 percent in February after rising 0.5 percent in January. For the 12 months ended in February, prices for final demand less foods, energy, and trade services advanced 4.4 percent.

Final demand goods: The index for final demand goods fell 0.2 percent in February following a 1.2-percent advance in January. A 2.2-percent decline in prices for final demand foods was a major factor in the February decrease. The index for final demand energy moved down 0.2 percent. In contrast, prices for final demand goods less foods and energy rose 0.3 percent.

Click image to enlarge

Okay, so let me blow my horn a bit, with last month's prediction...

Next month is likely to surprise to the low side, possibly even a monthly negative, with annual at the +4.4% range.

Okay, got that out of the way. All in all a good report, with many areas of hope. Now on to the "Nonfood materials less energy." Which, I guess, is similar to core... being without food and energy. That popped +1.2% for the month, following January's +1.6%. I get this feeling it will be near +1.8%, when March's numbers come out. 

Still, I would anticipate March to be year over year of +3.0%, and month to month being flat. 


Thursday, February 16, 2023

Today's PPI Release... February 16th, 2022

The BLS has released the January Producer Price Index Report. (historical releases)

The Producer Price Index for final demand increased 0.7 percent in January, seasonally adjusted, the U.S. Bureau of Labor Statistics reported today. Final demand prices declined 0.2 percent in December 2022 and advanced 0.3 percent in November. (See table A.) On an unadjusted basis, the index for final demand rose 6.0 percent for the 12 months ended January 2023. 

In January, a 1.2-percent rise in prices for final demand goods led the advance in the final demand index. Prices for final demand services also moved higher, increasing 0.4 percent.

The index for final demand less foods, energy, and trade services rose 0.6 percent in January 2023, the largest advance since moving up 0.9 percent in March 2022. For the 12 months ended in January 2023, prices for final demand less foods, energy, and trade services increased 4.5 percent. 

Click to Enlarge
So the numbers were higher than expectations. I think someone under estimated those numbers. Last month's intermediates suggested a pop in final demand for this month. My estimate was wrong at +0.8% for the month. That was a miss to the high side. 

Next month is likely to surprise to the low side, possibly even a monthly negative, with annual at the +4.4% range.

Probably wrong again, but hopefully, to the high side... again.

Wednesday, February 15, 2023

The January Retail Sales Report

ADVANCE MONTHLY SALES FOR RETAIL AND FOOD SERVICES, January 2023 

Advance Estimates of U.S. Retail and Food Services

Advance estimates of U.S. retail and food services sales for January 2023, adjusted for seasonal variation and holiday and trading-day differences, but not for price changes, were $697.0 billion, up 3.0 percent (±0.5 percent) from the previous month, and up 6.4 percent (±0.7 percent) above January 2022. Total sales for the November 2022 through January 2023 period were up 6.1 percent (±0.5 percent) from the same period a year ago. The November 2022 to December 2022 percent change was unrevised at down 1.1 percent (±0.3 percent).

Retail trade sales were up 2.3 percent (±0.5 percent) from December 2022, and up 3.9 percent (±0.5 percent) above last year. Food services and drinking places were up 25.2 percent (±2.6 percent) from January 2022, while general merchandise stores were up 4.5 percent (±0.2 percent) from last year. (emphasis added)

The data is not inflation adjusted. The data in this graph is...

Click to Enlarge
The clue being the emphasis I added in the clip from the release. Sales were up 6.4%, but so was inflation. Units of good, were basically the same as a year ago.

Over 68% of the total increase from December was in the following.
For anyone wishing to "annualize" today's numbers, we are in a rinse and repeat cycle, as indicated by previous year's numbers.

Click to Enlarge

To summarize... despite the "stellar" 3.0% rise in sales over December, we are back to January 2022, in goods purchased. The rest is inflation.

That's not bad, just not really "stellar", in my humble opinion.

Wednesday, January 18, 2023

Today's PPI Release... January 18th, 2022

 The BLS has released the December Producer Price Index Report. (historical releases)

The Producer Price Index for final demand declined 0.5 percent in December, seasonally adjusted, the U.S. Bureau of Labor Statistics reported today. Final demand prices advanced 0.2 percent in November and 0.4 percent in October. (See table A.) On an unadjusted basis, the index for final demand increased 6.2 percent in 2022 after rising 10.0 percent in 2021. In December, the decrease in the final demand index can be attributed to a 1.6-percent decline in prices for final demand goods.

Wait there is more...

Nearly half of the December decrease in the index for final demand goods can be traced to a 13.4-percent decline in prices for gasoline.

There are four stages of intermediate demand, with 3 having inflation rates slowing in December. However, stage 2 rate of inflation surged.

Stage 2 intermediate demand: Prices for stage 2 intermediate demand advanced 2.2 percent in December following three consecutive declines. In December, the index for total goods inputs to stage 2 intermediate demand rose 3.5 percent, and prices for total services inputs increased 1.1 percent. Advances in the indexes for natural gas, deposit services (partial), fuels and lubricants retailing, business loans (partial), carbon steel scrap, and aluminum base scrap outweighed declines in prices for crude petroleum, basic organic chemicals, and guestroom rental. In 2022, the index for stage 2 intermediate demand rose 8.7 percent after jumping 21.6 percent in 2021. 

Click to Enlarge

This morning's release created quite a stir, for a few moments. Of course this report and the Retail Sales came out together. Coupled... suppressed a lot of hoopla. Inflation may be slowing, but so is consumer spending, which is a very large part of the economy.

Some Clarity on the December Retail Trade Report

 ADVANCE MONTHLY SALES FOR RETAIL AND FOOD SERVICES, December 2022 

Advance estimates of U.S. retail and food services sales for December 2022, adjusted for seasonal variation and holiday and trading-day differences, but not for price changes, were $677.1 billion, down 1.1 percent (±0.5 percent) from the previous month, but up 6.0 percent (±0.7 percent) above December 2021. Total sales for the 12 months of 2022 were up 9.2 percent (±0.4 percent) from 2021. Total sales for the October 2022 through December 2022 period were up 6.7 percent (±0.5 percent) from the same period a year ago. The October 2022 to November 2022 percent change was revised from down 0.6 percent (±0.5 percent) to down 1.0 percent (±0.2 percent).

The data is not inflation adjusted. The data in this graph is...

Click to Enlarge
The blue dots represents what we have spent in current dollars, and the orange represents the quantity of stuff we have bought. This clearly represents the when... for ramp up of inflation. 

It should be noted the December of 2022 decline is similar to the December of 2021 decline. 

Click to Enlarge
Putting it another way, this report indicates that total sales in current dollars, has fallen back to May, 2022 levels, while Quantity bought is back to August 2021 levels.

Or a third way, is to note...
Click to Enlarge
Retail sales have been fairly flat, the past year, when adjusted for inflation. It would also be reflected in the drop off in trade deficit, which indicates the supply chain is nearly healed. 

Some food for thought. Initially, inflation was blamed on supply chain issues rather than monetary/fiscal policy, AND would thereby be transitory. That theory would indicate prices falling back to pre-supply chain problems. 

Those prices have become sticky and show no signs of falling back to pre-supply chain levels. Thus monetary/fiscal policy should be the focus.

In fairness, I believe the FED has been forced to address the Fiscal failings, by using implementing monetary policy. Although, whether fiscal or monetary, it is the same sorry bunch, imho.

Don't be fooled by last month's data, as core PCE has become quite sticky in the 0.35%~0.4% monthly range, which is still twice what the FED wants.. Also, the PPI fell more than expected, but you would have thought the magic number has finally arrived. 6.2% year over year is not magical, imho.


Thursday, December 15, 2022

What To Make of the November Retail Trade Report

ADVANCE MONTHLY SALES FOR RETAIL AND FOOD SERVICES, NOVEMBER 2022 

Advance estimates of U.S. retail and food services sales for November 2022, adjusted for seasonal variation and holiday and trading-day differences, but not for price changes, were $689.4 billion, down 0.6 percent (±0.5 percent) from the previous month, but up 6.5 percent (±0.7 percent) above November 2021.

Total sales for the September 2022 through November 2022 period were up 7.7 percent (±0.5 percent) from the same period a year ago. The September 2022 to October 2022 percent change was unrevised from up 1.3 percent (±0.2 percent).

Retail trade sales were down 0.8 percent (±0.5 percent) from October 2022, but up 5.4 percent (±0.7 percent) above last year. Gasoline stations were up 16.2 percent (±1.6 percent) from November 2021, while food services and drinking places were up 14.1 percent (±3.0 percent) from last year.

The biggest losers for the month...
  • Department stores
  • Furniture & home furn. Stores
  • Motor vehicle & parts dealers
  • Building material & garden eq. &
  • Electronics & appliance stores
Moderate Losers for the month...
  • Non-store retailers
  • Sporting goods, hobby, musical instrument, & book stores
There seems to be a bit of concern, as the sales rate fell more than anticipated. How much is seasonal and how much is consumers pinching pennies? 
  • We knew, or should have known, that Motor Vehicles were slowing, especially in the used car market, with lower prices. 
  • Building materials, etc. would seem likely to slip this time of year.
When we consider this release as being current dollars and then adjust for real dollar purchases... the line has been fairly flat for several months. Compared to last year in "inflation adjusted" dollars, this month is -0.2%. 
Of course, we must always remember that data may be adjusted in following months, as more data becomes available. So everything I have mentioned is based on incomplete data. Not very helpful, in my humble opinion, but the best available information. 

I don not understand the hoopla around this report. 

Friday, December 9, 2022

The Good and the Bad of Today's PPI Release... December 9th, 2022

The BLS has released the November Producer Price Index Report. (historical releases)

The Producer Price Index for final demand advanced 0.3 percent in November, seasonally adjusted, the U.S. Bureau of Labor Statistics reported today. Final demand prices also rose 0.3 percent in both October and September. (See table A.) On an unadjusted basis, the index for final demand moved up 7.4 percent for the 12 months ended in November. 

A little further in the report...
Product detail: The November advance in prices for final demand goods was led by a 38.1-percent jump in the index for fresh and dry vegetables. Prices for chicken eggs; meats; canned, cooked, smoked, or prepared poultry; and tobacco products also moved higher. Conversely, the gasoline index fell 6.0 percent. Prices for diesel fuel, residential natural gas, and primary basic organic chemicals also declined. [emphasis added]
Overall, a very good report, unless you are below average income. Which means food prices are not slowing anytime soon. Across the board, the total goods less foods and energy inputs is down, by an average of -0.3%, compared to -0.1% last month. Good news, with the energy components down -4.25%, compared to -3.2% last month. However, with energy down -4.25% and the total good, ex-F&E at -0.3%... guess what? Food jumped +0.4%, whereas last month it was down -3.2%.

Drought conditions are pushing up several categories. If the drought were to end tomorrow, it would still take several months to restock the supply chain. In the interim, expect grocery prices to continue upward, regardless of FED easing or tightening. 

If you are above average income and/or investing in stocks, etc., this report is indeed good news. On the other hand, if you are below average income, this report indicates some bare cupboards in the offing, in my humble opinion.

Remember most of the harvest is now in the bins, with feedstocks for livestock known and those livestock mostly culled to match that over winter feedstock. 

The outlook is not positive for a reduction in food inflation. Will energy prices continue to fall into the coming year? 

Wednesday, November 16, 2022

Retail Trade Still Holding Up, In Many Areas, But Not All

ADVANCE MONTHLY SALES FOR RETAIL AND FOOD SERVICES, OCTOBER 2022

Advance estimates of U.S. retail and food services sales for October 2022, adjusted for seasonal variation and holiday and trading-day differences, but not for price changes, were $694.5 billion, up 1.3 percent (±0.5 percent) from the previous month, and 8.3 percent (±0.7 percent) above October 2021. Total sales for the August 2022 through October 2022 period were up 8.9 percent (±0.5 percent) from the same period a year ago. The August 2022 to September 2022 percent change was unrevised from virtually unchanged (±0.2 percent)*.

Retail trade sales were up 1.2 percent (±0.5 percent) from September 2022, and up 7.5 percent (±0.7 percent) above last year. Gasoline stations were up 17.8 percent (±1.6 percent) from October 2021, while food services and drinking places were up 14.1 percent (±3.2 percent) from last year.

Winners were broad based, but there were some losers, as in reduced sales in constant dollars...
  • Department Stores
  • Sporting goods, hobby, musical instrument, & book stores
  • Electronics & appliance stores
  • Clothing & clothing accessories stores
There was one, that did not keep pace with inflation, or slipped in "real" dollars.
  • Miscellaneous store retailers
Not sure how the consumer is managing to keep up this pace of spending, which is at the February ~ April 2022 pace in "real" dollars. (Still not at the level of March ~ April 2021, in "real" dollars).

I can only speculate that consumers are going credit crazy. I have thought that for awhile and keep expecting the consumer to slow purchasing, as interest rates are edging up. 

I guess that whole "buy now, pay later" mantra hasn't gotten to the "later" part. 


Tuesday, November 15, 2022

Is PPI cooling for the Average Person? October 2022, PPI Release

The BLS has released the October Producer Price Index Report. (historical releases)

The Producer Price Index for final demand increased 0.2 percent in October, seasonally adjusted, the U.S. Bureau of Labor Statistics reported today. Final demand prices rose 0.2 percent in September and were unchanged in August. On an unadjusted basis, the index for final demand advanced 8.0 percent for the 12 months ended in October. 

You can read it all at the link, but this caught my eye...

Product detail: In October, 60 percent of the increase in prices for final demand goods is attributable to the index for gasoline, which rose 5.7 percent. Prices for diesel fuel, fresh and dry vegetables, residential electric power, chicken eggs, and oil field and gas field machinery also advanced. In contrast, the index for passenger cars declined 1.5 percent. (In accordance with usual practice, most new-model-year passenger cars and light motor trucks were introduced into the PPI in October. See Report on Quality Changes for 2023 Model Vehicles at www.bls.gov/web/ppi/ppimotveh.htm.) Prices for gas fuels and for processed young chickens also fell.
All in all a seemingly good report, as long as you avoid the food and energy section, and focus on services, which slid.

Just to clarify, a slowing of inflation does seem to be in the offing, but slowing does not mean reversal. Also, food and energy will still be an issue for us poorer folks through this winter. 

BRRR!

Friday, October 14, 2022

Retail Trade Report for September 2022

The Census Bureau has once again graced us with their monthly Retail Report for September 2022.

Advance estimates of U.S. retail and food services sales for September 2022, adjusted for seasonal variation and holiday and trading-day differences, but not for price changes, were $684.0 billion, virtually unchanged (±0.5 percent)* from the previous month, but 8.2 percent (±0.7 percent) above September 2021. 

Total sales for the July 2022 through September 2022 period were up 9.2 percent (±0.5 percent) from the same period a year ago. The July 2022 to August 2022 percent change was revised from up 0.3% (±0.5 percent)* to up 0.4 percent (±0.2 percent). Retail trade sales were down 0.1 percent (±0.4 percent)* from August 2022, but up 7.8 percent (±0.7 percent) above last year. 

Gasoline stations were up 20.6 percent (±1.6 percent) from September 2021, while Non-store retailers were up 11.6 percent (±1.1 percent) from last year

Allow me to give my interpretation. They revised the August data upward and September's advance estimate is almost no change, against an anticipated 2% rise. Which factoring in inflation, means "stuff bought index" was -0.2% less than August. 

So to really be clear, the money spent since September, 2021 has risen 8.23%, yet the stuff bought has edged up 0.02%.

Click to Enlarge

With every report, there are "winners" and "losers". It would be premature to see any trends, but I just can't help myself.

Click to Enlarge
It would almost seem the spending is closer to home, as in personal type things. We're slowing down on vehicles, furniture, electronics, building material, sporting good and focusing on feeding our bellies, dressing in style, beautifying ourselves, eating out and drinking away our misery.

What does it all mean? I have not a clue, which is why I am asking. BUTT, I just can't help myself and must opine some meaningless nonsense.

Just about everyone is screaming a recession is near. Just like that phrase "build it and they will come", saying recession over and over by enough people will bring on a recession. At this point, it is almost a certainty. The only things to determine are when, depth and duration.

I think a lot of people are altering their spending habits in preparation.

Thursday, September 15, 2022

Retail Trade Report for August 2022

The Census Bureau has once again graced us with their monthly Retail Report for August 2022.

Advance Estimates of U.S. Retail and Food Services

Advance estimates of U.S. retail and food services sales for August 2022, adjusted for seasonal variation and holiday and trading-day differences, but not for price changes, were $683.3 billion, an increase of 0.3 percent (±0.5 percent)* from the previous month, and 9.1 percent (±0.7 percent) above August 2021.

Total sales for the June 2022 through August 2022 period were up 9.3 percent (±0.5 percent) from the same period a year ago. The June 2022 to July 2022 percent change was revised from virtually unchanged (±0.5 percent)* to down 0.4 percent (±0.2 percent).

Once again, we get previous months revised downward and current month edges up, as a result. Let's not focus on the past, but consider the current, while expecting it to be revised in the future. Been that way as long as I can remember, but I am also at that age, where memory is in question.

Click to Enlarge
This monthly chart of mine is an unscientific method of tracking retail. I just adjust the "adjusted" report numbers to rate of inflation. Like I said... not very scientific, but probably not that far off. Essentially, the stuff bought peaked in March ~ May of 2021. Inflation has made up the difference, in my humble opinion.

Seriously, the retail grocery spending is up 7.7% from last year, yet the CPI-U has food at home jumping 13.5%. Somebody, somewhere... is dialing back on type and/or quantity of food.

Gasoline stations are more than just gasoline, as it encompasses convenience stores. Which helps explain the drop in retail gasoline stations not quite matching the price at the pump. 

Of course, there are some winners to go along with the losers. Electronic and Appliances continue to shed a bit of ground. Either we already bought enough freezers back early during all the shortages, or we simply cannot afford the high price of freezer meats, so what is the point of buying freezers?

Mail order would seem to be on strong footing, except it slid last month, while box stores rallied. Not a lot, but it was in reverse of what I was thinking. 

There is a spreadsheet on the Census website, with some data to peruse. 

As the peak was in Spring of 2021, with moderate dip since, demand destruction is not really evident. In my humble opinion, inflation is likely to stick around. How long... no one really knows.

Wednesday, August 17, 2022

Retail Trade Report for July 2022

The Census Bureau released the Advance July Retail Sales Report, this AM.

Advance Estimates of U.S. Retail and Food Services

Advance estimates of U.S. retail and food services sales for July 2022, adjusted for seasonal variation and holiday and trading-day differences, but not for price changes, were $682.8 billion, virtually unchanged (±0.5 percent)* from the previous month, but 10.3 percent (±0.7 percent) above July 2021. Total sales for the May 2022 through July 2022 period were up 9.2 percent (±0.5 percent) from the same period a year ago. The May 2022 to June 2022 percent change was revised from up 1.0 percent (±0.5 percent) to up 0.8 percent (±0.2 percent).

Retail trade sales were virtually unchanged (±0.4 percent)* from June 2022, but up 10.1 percent (±0.7 percent) above last year. Gasoline stations were up 39.9 percent (±1.6 percent) from July 2021, while nonstore retailers were up 20.2 percent (±1.2 percent) from last year.

On my very unscientific graph, the impact with CPI inflation backed out of the numbers.


Still not seeing that demand destruction that I would expect to see for a recession. Looking at the winners and losers, seems to confirm that notion.
We should be aware of the ongoing issues with the auto industry and even a minimal user of gasoline, such as myself, would know the pump prices are falling.

The non store retailers, which would include mail order, etc. is up, and building material, garden equipment, etc. is also up. Somehow, I would expect these two to slip a bit, if a recession were taking place. 

Granted, I have know idea where the money is coming from, to continue this level of spending, and would not have an idea of when it might end. I can only speculate, it might slow in the coming months. Of course, a simple explanation would be the savings from the pump are being redirected.

That speculation is simply based on the uneasy feeling that winter heating and electric bills will offset the gains at the gasoline pump. I will attempt to delve into that worrying trend in the next couple of days. 

Friday, July 15, 2022

Retail Trade Report for June 2022

Start off with the Census Bureau release...

Advance Estimates of U.S. Retail and Food Services

Advance estimates of U.S. retail and food services sales for June 2022, adjusted for seasonal variation and holiday and trading-day differences, but not for price changes, were $680.6 billion, an increase of 1.0 percent (±0.5 percent) from the previous month, and 8.4 percent (±0.7 percent) above June 2021. Total sales for the April 2022 through June 2022 period were up 8.1 percent (±0.5 percent) from the same period a year ago. The April 2022 to May 2022 percent change was revised from down 0.3 percent (±0.5 percent)* to down 0.1 percent (±0.3 percent)*.

Retail trade sales were up 1.0 percent (±0.4 percent) from May 2022, and up 7.7 percent (±0.7 percent) above last year. Gasoline stations were up 49.1 percent (±1.6 percent) from June 2021, while food services and drinking places were up 13.4 percent (±3.9 percent) from last year. (emphasis added)

Once again, gasoline played a major factor. However, accounting for inflation and backing out gasoline, the sales were flat... over the month. 


My nutty assessment... We are foregoing fixing up the house and ourselves, placing emphasis on getting back and forth to work and using online shopping from our new comfortable recliner!! 

How else can you explain it.

All in all, not a bad report, as holding steady outside of gasoline is quite a feat, in my opinion.

Of course, we're still paying more for less... a trend likely to continue, until we run out of money and/or credit. 

So when the headline says something like "excluding gas stations, consumer spending was up 5.3% the past year". That 5.3% is NOT inflation adjusted. Just remember, excluding energy, inflation was up 6.6% in the past year. So we are back to spending more for less. 

We already knew that!!

This Week in Petroleum Summary May 8th, 2024 per EIA.GOV

This week's  full report . Gasoline fell -2.3¢ for the week, but remains +10.3¢ from year ago level. Consumption did edge up this past r...