Showing posts with label producer price index. Show all posts

Thursday, April 11, 2024

PPI APR. 2024 release March 2024 Data

The BLS has released the March, 2024 Producer Price Index Report (historical releases)

The Producer Price Index for final demand rose 0.2 percent in March, seasonally adjusted, the U.S. Bureau of Labor Statistics reported today. Final demand prices moved up 0.6 percent in February and 0.4 percent in January. (See table A.) On an unadjusted basis, the index for final demand increased 2.1 percent for the 12 months ended in March, the largest advance since rising 2.3 percent for the 12 months ended April 2023.

The March increase in the index for final demand is attributable to a 0.3-percent rise in prices for final demand services. In contrast, the index for final demand goods edged down 0.1 percent.

The index for final demand less foods, energy, and trade services moved up 0.2 percent in March after rising 0.3 percent in February. For the 12 months ended in March, prices for final demand less foods, energy, and trade services increased 2.8 percent.

Now for a graph and chart...


As stated, the 2.1% is the highest final demand number since April 2023. There seems to be some quibbling over that number, as related to gasoline prices. I should point out the "preliminary" tag on many items. So we can expect some more adjustments in those months.

I have read where the final demand would have been 2.4%, had the gasoline been correctly attributed. I don't think the annual would have seen that. However, the monthly figure is indeed laughable, and should have been near last month's figure.. 

The final demand is creeping up, which is troubling. Even more troubling is the final demand for food, which popped a healthy +0.8% on the month, which follows +1.1% for the previous month. Chew on that for awhile.


Thursday, March 14, 2024

PPI Mar. 2024 release February 2024 Data

The BLS has released the February, 2024 Producer Price Index Report (historical releases)

The Producer Price Index for final demand rose 0.6 percent in February, seasonally adjusted, the U.S. Bureau of Labor Statistics reported today. Final demand prices increased 0.3 percent in January and edged down 0.1 percent in December 2023. (See table A.) On an unadjusted basis, the final demand index advanced 1.6 percent for the 12 months ended in February, the largest rise since moving up 1.8 percent for the 12 months ended September 2023.

In February, nearly two-thirds of the rise in final demand prices can be traced to the index for final demand goods, which advanced 1.2 percent. Prices for final demand services moved up 0.3 percent.

The index for final demand less foods, energy, and trade services increased 0.4 percent in February after rising 0.6 percent in January. For the 12 months ended in February, prices for final demand less foods, energy, and trade services moved up 2.8 percent.

Current graph with revisions...

Then there is this chart, which briefly compares the category to previous month's annual rate.


So the report was deemed as troubling, as it will be passed on to the consumer. No doubt inflation is not down to the level sought, but not a rapid acceleration. More of tepid acceleration in my opinion.


Friday, February 16, 2024

PPI Feb. 2024 release January 2024 Data

The BLS has released the January, 2024 Producer Price Index Report (historical releases) 

Final demand services: The index for final demand services moved up 0.6 percent in January, the largest increase since rising 0.8 percent in July 2023. In January, most of the advance is attributable to prices for final demand services less trade, transportation, and warehousing, which climbed 0.8 percent. The index for final demand trade services moved up 0.2 percent. (Trade indexes measure changes in margins received by wholesalers and retailers.) Conversely, prices for final demand transportation and warehousing services fell 0.4 percent. 

Product detail: A 2.2-percent increase in the index for hospital outpatient care was a major factor in the January rise in prices for final demand services. The indexes for chemicals and allied products wholesaling, machinery and equipment wholesaling, portfolio management, traveler accommodation services, and legal services also moved higher. In contrast, prices for long-distance motor carrying decreased 1.0 percent. The indexes for computer hardware, software, and supplies retailing and for engineering services also moved lower. (See table 2.)

I emphasized a specfic portion. after much jockeying with revisions of numbers in the medical category over the past year... those have come to and end. So after all these revision helped tamp down inflation numbers, those days are over.


The headlines have focused on how the PPI report came in hotter than expected. I wonder if the expectations are real or some hope of immediate relief in those interest rates. It is coming, just not tomorrow. 

Friday, January 12, 2024

Producer Price Index January release December 2023 Data

The BLS has released the December Producer Price Index Report (historical releases)

The Producer Price Index for final demand fell 0.1 percent in December, seasonally adjusted, the U.S. Bureau of Labor Statistics reported today. Final demand prices moved down 0.1 percent in November and 0.4 percent in October. (See table A.) On an unadjusted basis, the index for final demand rose 1.0 percent in 2023 after increasing 6.4 percent in 2022.

If the PPI is really a forerunner of consumer inflation, then CPI should continue to ease, as PPI has nearing same rate as CPI in the periods outlined below.


I would hope the drops in food and energy will continue, or at least stabilize. I suspect energy will creep up in the coming months, as this is a seasonal lull, according to previous December reports. Those same reports suggest a seasonal lull for foods.

I guess it is important to find the good news and celebrate... however fleeting it might be.

Wednesday, December 13, 2023

Producer Price Index December release November 2023 Data

The BLS has released the November Producer Price Index Report (historical releases)

The Producer Price Index for final demand was unchanged in November, seasonally adjusted, the U.S. Bureau of Labor Statistics reported today. Final demand prices decreased 0.4 percent in October and rose 0.4 percent in September. (See table A.) On an unadjusted basis, the index for final demand increased 0.9 percent for the 12 months ended in November.

In November, the indexes for both final demand goods and for final demand services were unchanged. 


Final demand goods: The index for final demand goods was unchanged in November after dropping 1.4 percent in October. In November, price increases of 0.6 percent for final demand foods and 0.2 percent for final demand goods less foods and energy offset a 1.2-percent decrease in the index for final demand energy.

Let's revisit that paragraph. What did the -1.2% decrease in the index for final demand energy... offset?

Within final demand goods in November, prices for chicken eggs jumped 58.8 percent. The indexes for fresh fruits and melons, utility natural gas, electric power, and carbon steel scrap also moved higher. In contrast, prices for gasoline fell 4.1 percent.

So gasoline (-4.1%), which is typically moving into seasonal lows, is the reason for that -1.2% decrease, which offsets a bunch of rises in food (+0.6%) and other energy components. 

Not to nitpick, but if gasoline is having that impact, and is moving into seasonal lows, which might continue through the December release... could reverse beginning after Christmas, just like last year.

For those of us that like to eat food, that annualized 7.2% increase in food is going to weigh on the budget of many of us, unless we decide to eat less and lose "weight".

Wednesday, October 11, 2023

Producer Price Index October release with September 2023 Data

The BLS has released the September Producer Price Index Report (historical releases) 

The Producer Price Index for final demand increased 0.5 percent in September, seasonally adjusted, the U.S. Bureau of Labor Statistics reported today. Final demand prices rose 0.7 percent in August and 0.6 percent in July. (See table A.) On an unadjusted basis, the index for final demand advanced 2.2 percent for the 12 months ended in September, the largest increase since moving up 2.3 percent for the 12 months ended in April. 

Leading the increase in the final demand index in September, prices for final demand goods rose 0.9 percent. The index for final demand services advanced 0.3 percent.

Prices for final demand less foods, energy, and trade services increased 0.2 percent in September, the fourth consecutive advance. For the 12 months ended in September, the index for final demand less foods, energy, and trade services moved up 2.8 percent.


As is often the case... there were revisions to previous month's data, so don't be surprised if this month's data is revised next month. The size of July's data was a bit surprising however. When that data came out, it was considered above expectations at +0.3%. A couple of month's later, it was revised to +0.6%, without any discussion.


In any case, I will continue to track, but this should wrap up publishing my thoughts.


Thursday, September 14, 2023

Producer Price Index September release with August 2023 Data

The BLS has released the July Producer Price Index Report (historical releases) 

The Producer Price Index for final demand increased 0.7 percent in August, seasonally adjusted, after rising 0.4 percent in July, the U.S. Bureau of Labor Statistics reported today. (See table A.) The August advance is the largest increase in final demand prices since moving up 0.9 percent in June 2022. On an unadjusted basis, the index for final demand rose 1.6 percent for the 12 months ended in August.

In August, 80 percent of the rise in final demand prices is attributable to a 2.0-percent jump in the index for final demand goods. Prices for final demand services advanced 0.2 percent.

The index for final demand less foods, energy, and trade services increased 0.3 percent in August, the same as in July. For the 12 months ended in August, prices for final demand less foods, energy, and trade services rose 3.0 percent, the largest advance since moving up 3.4 percent for the 12 months ended in April.


So, the story is about gasoline prices creating most of the PPI. This might be true, but the current forecast is up and not down for that commodity.


Everything is screaming some future relief, except for what drove the August PPI higher. September is shaping up as a repeat of August, imho.


Not the most scientific metric, but there is more pink than last month. Not saying inflation is about to accelerate, but not so sure that crude oil will taper off its current rise. And we should remember that yesterday's CPI report mentioned the impact of gasoline, but also indicated that energy prices were down compared to one year ago... current at 294.328, year ago at 305.372. Gasoline current... 336.979, year ago at 348.593.

So, if last month's PPI was impacted by energy and thereby distorting the number, then energy being cheaper this year than last... would indicate the YoY 1.6% is also distorted. In fact the release indicates the PPI excluding energy was 2.0%. 

That is not a bad number, imho. Things are indeed looking up... except for pump prices, which are also looking up, but not in a good way.

Friday, August 11, 2023

Producer Price Index August 2023 release

The BLS has released the July Producer Price Index Report (historical releases) 

The Producer Price Index for final demand increased 0.3 percent in July, seasonally adjusted, the U.S. Bureau of Labor Statistics reported today. Final demand prices were unchanged in June and declined 0.3 percent in May. (See table A.) On an unadjusted basis, the index for final demand advanced 0.8 percent for the 12 months ended in July. 

In July, the increase in final demand prices was led by a 0.5-percent rise in the index for final demand services. Prices for final demand goods edged up 0.1 percent.

The rate of increases has somewhat slowed and selected areas are now trending downward. The PPI since start of Covid has risen 17.3%, compared to the CPI rise of 19.2%. (That is just two data points and should not be construed as any indication of some guaranteed future changes.)

Certainly improvement, but overall a "D" rating as for inflation outlook, imho. August would appear to have a further inflation uptick, from July's reports. 


Thursday, July 13, 2023

Producer Price Index July 2023 release for June Data.

The BLS has released the June Producer Price Index Report (historical releases) 

The Producer Price Index for final demand increased 0.1 percent in June, seasonally adjusted, the U.S. Bureau of Labor Statistics reported today. Final demand prices declined 0.4 percent in May and edged up 0.1 percent in April. (See table A.) On an unadjusted basis, the index for final demand advanced 0.1 percent for the 12 months ended in June. 

In June, the increase in final demand prices can be traced to a 0.2-percent rise in the index for final demand services. Prices for final demand goods were unchanged.

The index for final demand less foods, energy, and trade services moved up 0.1 percent in June after no change in May. For the 12 months ended in June, prices for final demand less foods, energy, and trade services advanced 2.6 percent.


The rate of increases has slowed and selected areas are now trending downward. The PPI since start of Covid has risen 17.8%, compared to the CPI rise of 18.3%. (That is just two data points and should not be construed as any indication of some guaranteed future changes.)

The downward trend continues...

Except...

The attention is now shifting to "services"..

Even this will likely resume falling by next month, as it is an annual rate. The montly stood flat, after two months of gains.

Still, a good report... IF the trend continues.

Wednesday, June 14, 2023

Producer Price Index June 2023 release for May Data.

The BLS has released the April Producer Price Index Report (historical releases)

The Producer Price Index for final demand declined 0.3 percent in May, seasonally adjusted, the U.S. Bureau of Labor Statistics reported today. Final demand prices rose 0.2 percent in April and fell 0.4 percent in March. On an unadjusted basis, the index for final demand moved up 1.1 percent for the 12 months ended in May.

In May, the decline in the final demand index can be traced to prices for final demand goods, which fell 1.6 percent. The index for final demand services increased 0.2 percent. 

Prices for final demand less foods, energy, and trade services were unchanged in May after inching up 0.1 percent in April. For the 12 months ended in May, the index for final demand less foods, energy, and trade services increased 2.8 percent. 

Overall, the trend is downward and some relief might be in sight for the consumer.

The decreased costs in unprocessed intermediate, have not completely moved into the processed area. Possibly by next month? 
Unprocessed goods for intermediate demand: The index for unprocessed goods for intermediate demand fell 4.8 percent in May after increasing 1.6 percent in April. Almost 60 percent of the broad- based decrease is attributable to a 7.8-percent drop in prices for unprocessed energy materials
Nearly 60 percent of the May decline in the index for unprocessed goods for 
intermediate demand can be traced to prices for crude petroleum, which fell 10.2 percent.
The price drops all across the petroleum sector are evident in the report. Another big drop should be forthcoming in the report for June, as this sector peaked last June. 

After that, the impact of petroleum will decrease and the focus will shift elsewhere. As the saying goes... the low hanging fruit will have been picked by fall. 

When looking at the overall, as in the first graph and seeing it hold relatively steady, then realizing the significant drops in energy... sticky it is.

Thursday, May 11, 2023

Producer Price Index May 2023 release for April Data.

The BLS has released the April Producer Price Index Report (historical releases)

The Producer Price Index for final demand advanced 0.2 percent in April, seasonally adjusted, the U.S. Bureau of Labor Statistics reported today. Final demand prices fell 0.4 percent in March and were unchanged in February. On an unadjusted basis, the index for final demand moved up 2.3 percent for the 12 months ended in April. 

In April, 80 percent of the rise in the index for final demand is attributable to a 0.3-percent increase in prices for final demand services. The index for final demand goods advanced 0.2 percent.

Prices for final demand less foods, energy, and trade services rose 0.2 percent in April after inching up 0.1 percent in March. For the 12 months ended in April, the index for final demand less foods, energy, and trade services increased 3.4 percent.

Certainly, the PPI increases have slowed, but not sure all has been reflected in the CPI. Historically, the CPI is has risen slightly faster that PPI, yet the past 3 years has seen the PPI outdistance the CPI. This is reflected in the following graph.

The chart indicates the comparison of that 39 month period, compared to the preceding 109 months.

Reverting to normal requires a negative PPI and/or continued inflation for the next few months. 

It will take most of the year, before normal takes places, imho. 

Thursday, April 13, 2023

Producer Price Index Apr 2023 release for March Data.

The BLS has released the March Producer Price Index Report (historical releases)

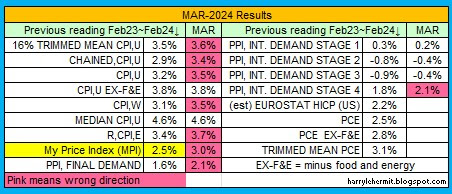
The Producer Price Index for final demand declined 0.5 percent in March, seasonally adjusted, the U.S. Bureau of Labor Statistics reported today. Final demand prices were unchanged in February and increased 0.4 percent in January. (See table A.) On an unadjusted basis, the index for final demand advanced 2.7 percent for the 12 months ended in March. 

In March, two-thirds of the decline in the index for final demand can be attributed to a 1.0-percent decrease in prices for final demand goods. The index for final demand services moved down 0.3 percent.

Prices for final demand less foods, energy, and trade services edged up 0.1 percent in March after rising 0.2 percent in February. For the 12 months ended in March, the index for final demand less foods, energy, and trade services increased 3.6 percent.

Last month's projection...

Still, I would anticipate March to be year over year of +3.0%, and month to month being flat. 

Not too bad for a complete idiot.

Now for my version of spin, or misdirection, or whatever. I tend to look for things that impact me, so my version... may not match your version.

Off the top, the energy index was almost 3/4 of that -0.5% m/m decline in final demand. While most everyone thinks of gasoline, it did rise in March and will continue to do so... maybe through May. It will not achieve last year's June highs, in my opinion. 

The story in energy is natural gas. This will show declines into the summer. I don't think it will achieve last summer's high, but it might come close. The upshot being a continuation of m/m declines and annual rates declining into that period.

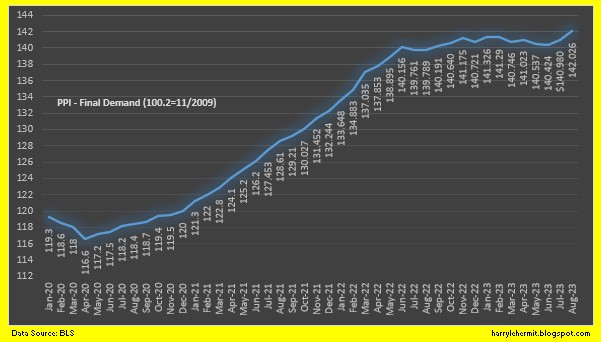
Currently the PPI final demand number is sitting at 20.8% above the April, 2020 low. The CPI, for reference, is 17.7% above that same period. I would not project any significant correlation between those two figures.

March's number, per the PPIFIS, stands at 140.865, compared to last June's 140.156. It is still +0.5% from June. Clearly, the y/y will continue to decline, but how far will it decline?

Being someone that consumes food on a regular basis, I should point out the final demand on food was +0.6% m/m. That is stark contrast from yesterday's CPI "food at home", at -0.3%. That concerns me more than the rise in current pump prices. 

My review of the PPI data, leads me to believe the (core) sticky prices are stuck in the near term. The year over year, however, will continue to fall. At some part, core will also begin to slip.

Next month will likely show another -0.2% m/m, and a +2.0% y/y. No doubt the y/y will likely turn negative in the next few months, largely due to energy. At some point in the summer, the sticky core will have to pitch in, to keep the numbers in decline.

BUT, if that occurs, is it due to slowing demand?

Smarter minds will have to weigh in on that question.

Wednesday, March 15, 2023

The BLS has released the February Producer Price Index Report. (historical releases)

The BLS has released the February Producer Price Index Report. (historical releases)

The Producer Price Index for Final Demand decreased 0.1 percent in February, seasonally adjusted, the U.S. Bureau of Labor Statistics reported today. Final demand prices advanced 0.3 percent in January and declined 0.2 percent in December 2022. (See table A.) On an unadjusted basis, the final demand index rose 4.6 percent for the 12 months ended in February.

In February, the decline in the final demand index was led by prices for final demand goods, which fell 0.2 percent. The index for final demand services edged down 0.1 percent.

The index for final demand less foods, energy, and trade services increased 0.2 percent in February after rising 0.5 percent in January. For the 12 months ended in February, prices for final demand less foods, energy, and trade services advanced 4.4 percent.

Final demand goods: The index for final demand goods fell 0.2 percent in February following a 1.2-percent advance in January. A 2.2-percent decline in prices for final demand foods was a major factor in the February decrease. The index for final demand energy moved down 0.2 percent. In contrast, prices for final demand goods less foods and energy rose 0.3 percent.

Click image to enlarge

Okay, so let me blow my horn a bit, with last month's prediction...

Next month is likely to surprise to the low side, possibly even a monthly negative, with annual at the +4.4% range.

Okay, got that out of the way. All in all a good report, with many areas of hope. Now on to the "Nonfood materials less energy." Which, I guess, is similar to core... being without food and energy. That popped +1.2% for the month, following January's +1.6%. I get this feeling it will be near +1.8%, when March's numbers come out. 

Still, I would anticipate March to be year over year of +3.0%, and month to month being flat. 


Thursday, February 16, 2023

Today's PPI Release... February 16th, 2022

The BLS has released the January Producer Price Index Report. (historical releases)

The Producer Price Index for final demand increased 0.7 percent in January, seasonally adjusted, the U.S. Bureau of Labor Statistics reported today. Final demand prices declined 0.2 percent in December 2022 and advanced 0.3 percent in November. (See table A.) On an unadjusted basis, the index for final demand rose 6.0 percent for the 12 months ended January 2023. 

In January, a 1.2-percent rise in prices for final demand goods led the advance in the final demand index. Prices for final demand services also moved higher, increasing 0.4 percent.

The index for final demand less foods, energy, and trade services rose 0.6 percent in January 2023, the largest advance since moving up 0.9 percent in March 2022. For the 12 months ended in January 2023, prices for final demand less foods, energy, and trade services increased 4.5 percent. 

Click to Enlarge
So the numbers were higher than expectations. I think someone under estimated those numbers. Last month's intermediates suggested a pop in final demand for this month. My estimate was wrong at +0.8% for the month. That was a miss to the high side. 

Next month is likely to surprise to the low side, possibly even a monthly negative, with annual at the +4.4% range.

Probably wrong again, but hopefully, to the high side... again.

Wednesday, January 18, 2023

Today's PPI Release... January 18th, 2022

 The BLS has released the December Producer Price Index Report. (historical releases)

The Producer Price Index for final demand declined 0.5 percent in December, seasonally adjusted, the U.S. Bureau of Labor Statistics reported today. Final demand prices advanced 0.2 percent in November and 0.4 percent in October. (See table A.) On an unadjusted basis, the index for final demand increased 6.2 percent in 2022 after rising 10.0 percent in 2021. In December, the decrease in the final demand index can be attributed to a 1.6-percent decline in prices for final demand goods.

Wait there is more...

Nearly half of the December decrease in the index for final demand goods can be traced to a 13.4-percent decline in prices for gasoline.

There are four stages of intermediate demand, with 3 having inflation rates slowing in December. However, stage 2 rate of inflation surged.

Stage 2 intermediate demand: Prices for stage 2 intermediate demand advanced 2.2 percent in December following three consecutive declines. In December, the index for total goods inputs to stage 2 intermediate demand rose 3.5 percent, and prices for total services inputs increased 1.1 percent. Advances in the indexes for natural gas, deposit services (partial), fuels and lubricants retailing, business loans (partial), carbon steel scrap, and aluminum base scrap outweighed declines in prices for crude petroleum, basic organic chemicals, and guestroom rental. In 2022, the index for stage 2 intermediate demand rose 8.7 percent after jumping 21.6 percent in 2021. 

Click to Enlarge

This morning's release created quite a stir, for a few moments. Of course this report and the Retail Sales came out together. Coupled... suppressed a lot of hoopla. Inflation may be slowing, but so is consumer spending, which is a very large part of the economy.

Friday, December 9, 2022

The Good and the Bad of Today's PPI Release... December 9th, 2022

The BLS has released the November Producer Price Index Report. (historical releases)

The Producer Price Index for final demand advanced 0.3 percent in November, seasonally adjusted, the U.S. Bureau of Labor Statistics reported today. Final demand prices also rose 0.3 percent in both October and September. (See table A.) On an unadjusted basis, the index for final demand moved up 7.4 percent for the 12 months ended in November. 

A little further in the report...
Product detail: The November advance in prices for final demand goods was led by a 38.1-percent jump in the index for fresh and dry vegetables. Prices for chicken eggs; meats; canned, cooked, smoked, or prepared poultry; and tobacco products also moved higher. Conversely, the gasoline index fell 6.0 percent. Prices for diesel fuel, residential natural gas, and primary basic organic chemicals also declined. [emphasis added]
Overall, a very good report, unless you are below average income. Which means food prices are not slowing anytime soon. Across the board, the total goods less foods and energy inputs is down, by an average of -0.3%, compared to -0.1% last month. Good news, with the energy components down -4.25%, compared to -3.2% last month. However, with energy down -4.25% and the total good, ex-F&E at -0.3%... guess what? Food jumped +0.4%, whereas last month it was down -3.2%.

Drought conditions are pushing up several categories. If the drought were to end tomorrow, it would still take several months to restock the supply chain. In the interim, expect grocery prices to continue upward, regardless of FED easing or tightening. 

If you are above average income and/or investing in stocks, etc., this report is indeed good news. On the other hand, if you are below average income, this report indicates some bare cupboards in the offing, in my humble opinion.

Remember most of the harvest is now in the bins, with feedstocks for livestock known and those livestock mostly culled to match that over winter feedstock. 

The outlook is not positive for a reduction in food inflation. Will energy prices continue to fall into the coming year? 

Tuesday, November 15, 2022

Is PPI cooling for the Average Person? October 2022, PPI Release

The BLS has released the October Producer Price Index Report. (historical releases)

The Producer Price Index for final demand increased 0.2 percent in October, seasonally adjusted, the U.S. Bureau of Labor Statistics reported today. Final demand prices rose 0.2 percent in September and were unchanged in August. On an unadjusted basis, the index for final demand advanced 8.0 percent for the 12 months ended in October. 

You can read it all at the link, but this caught my eye...

Product detail: In October, 60 percent of the increase in prices for final demand goods is attributable to the index for gasoline, which rose 5.7 percent. Prices for diesel fuel, fresh and dry vegetables, residential electric power, chicken eggs, and oil field and gas field machinery also advanced. In contrast, the index for passenger cars declined 1.5 percent. (In accordance with usual practice, most new-model-year passenger cars and light motor trucks were introduced into the PPI in October. See Report on Quality Changes for 2023 Model Vehicles at www.bls.gov/web/ppi/ppimotveh.htm.) Prices for gas fuels and for processed young chickens also fell.
All in all a seemingly good report, as long as you avoid the food and energy section, and focus on services, which slid.

Just to clarify, a slowing of inflation does seem to be in the offing, but slowing does not mean reversal. Also, food and energy will still be an issue for us poorer folks through this winter. 

BRRR!

Wednesday, October 12, 2022

Producer Price Index for September 2022

Isn't this exciting... the BLS has released the September Producer Price Index Report. (historical releases)

The Producer Price Index for final demand increased 0.4 percent in September, seasonally adjusted, the U.S. Bureau of Labor Statistics reported today. Final demand prices declined 0.2 percent in August and 0.4 percent in July. (See table A.) On an unadjusted basis, the index for final demand advanced 8.5 percent for the 12 months ended in September.

Click to Enlarge

After two months of declines, it popped back up. The CPI remained flat those two months, so it would not be unreasonable to think tomorrow CPI, to show a gain.

Far greater minds than I have indicated the Food and Energy Index, is moving upwards and sticky prices (core) have become stuck. I mean we have forecasts from really smart people, saying September CPI will advance +0.3% and October at +0.8%. That with core stagnating at +0.5% for each month.

So gasoline is back in the picture, as pump prices are on the rise. The average for October is +3.5%, after falling in July by -7.7%; August by -10.1%; and September at -5.2%. That helped cover up a lot of sins. Supposedly, weaker demand would drive down prices. However, the actual data, points to demand slightly increasing, the past 3 weeks and back to August levels.

Having followed EIA.gov weekly reports on energy for over 15 years, I was amazed at the discrepancies in last week's report. I would expect some wild swings in tomorrow's report. More on that... tomorrow.

Food is near and dear to my heart (Stomach and heart are less than a foot apart, and that is foot in measurements, not that other body part. Less than 30CM.)...

Click to Enlarge
There does not seem to be much relief in the food category either. The index is up 11.9% from last year, and +1.2% for the month. The latter being +14.4% annualized and not a good indicator of things to come. I would expect the annualized to slip below the year to year actual, for relief to be seen.

What does all this mean? OPEC+ is supposedly dropping production by 2 million BPD, beginning November the 1st., although Russia says they have already done half of that. That 180 million barrel SPR release is slated to end on October 31st. 

Biden has suggested another SPR release, but I doubt it... as he needs to save some ammunition for the 2024 election. The mid terms are November the 8th. 

The advance GDP for 2022 3rd quarter comes out at end of October. However the CPI comes out tomorrow and I cannot help but think, it will be a disappointment for those expecting some dramatic easing (stock markets). 

Possibly the Real Earnings report from tomorrow, might get some positive spin, but still likely not to get back to pre-covid level. 

Retail Sales comes out on Friday and I do not expect happy news either, ONCE you factor the inflation in. This report is always in current dollars, NOT chained dollars or adjusted for inflation.

We have 26 days of political theater, before the mid-terms. Then it revolves around 2024. So prepare to clean your B.S. meter very quickly after November the 8th and possibly consider a major upgrade, with expanded capacity. It will be needed.


Wednesday, September 14, 2022

Producer Price Index for August 2022

Time for more painful inflationary discussion. The BLS has now released the August Report. (historical releases)

Click to Enlarge

A 2nd month of easing on the PPI at -0.1%. That follows a revision of last month from -0.5% to -0.4%. Does that mean August's reading was essentially flat?

Click to Enlarge

Thus far the gauges are mixed, with 16% trimmed mean, CPI-U core, Median CPI-U and Demand Stage 2 on the rise.

Delving into the data, suggests that some moderation is taking place, except in energy  and food. We all realize or understand that gasoline prices are falling. However, gasoline is not the only story in energy. Electricity and Natural Gas are on the rise.

Food gives an interesting story and possibly some hope of slowing prices, if selective...
Click to Enlarge
Let's not count our chickens, before they hatch. Granted egg prices and processed young chickens are falling, but another bout of bird flu, could squelch that fall. That might seem like chicken feed in the grand scheme of things, but chicken feed is also necessary for continued fall in prices.

Replenishment of chickens in the industry can be fairly rapid, as in a few months as chickens can lay a lot of eggs. A hatchling is ready for the frying pan in less than 3 months and ready to lay eggs at roughly 18 weeks. Hogs, have multiple offspring in batches of possibly 2 per year and slaughter ready at about 6 months. Cattle is a matter of years, as a heifer can be bred between 16~30 months, generally with one calf, which requires 9 months and then 30 months to slaughter. 

What does all that mean? Cattle, Chickens, Turkeys, Hogs... require feed stock, which can be Hay or Grains. There is not a lot of pullback on grain prices. Weather is, will be, and always has been an issue with agriculture. As commodities were globalized to offset some of this issues, the chickens have come home to roost... weatherwise.

The weather has not been a good crop year in large areas of our planet. In some areas, it has started turning into a multi-year problem.

This has resulted in thinning of livestock, et al, as feedstock becomes too expensive, whether through drought, excessive rains, etc. 

With electricity and natural gas likely to displace gasoline as the big issue this coming winter, food prices will likely continue to rise for several more months. I would hope not, but the outlook is not so positive going forward, in my humble opinion. So what should a person do? If I knew, I would tell you.


Thursday, August 11, 2022

Producer Price Index for July 2022

Time for more painful inflationary discussion. The BLS has now released the July Report. (historical releases)

The basic graph...

Yeehaw!! We finally have a negative number -0.5%... the first since March, 2020. We can jump for joy, as the inflation peak is finally here. Or is it?

Maybe not, if you like to do certain things... like eat. Food +1.0% M/M and +15% Y/Y. Of course, we shouldn't put all our eggs in one basket, although eggs up are +44.2% for the month and 171.5% for the past year. Maybe one egg is all you can afford. Can you even afford the basket?

After a slowdown in beef and veal and some easing of pricing at both the CPI and PPI... guess what? Down -4.4% since last year, but up 9.5% for the month!! Maybe time for the other "white" meat, as pork continues to slip, -0.5% for the month and -7.7% annual. Maybe some chicken, as well. 

BTW, foods are largely weather dependent and in case you haven't noticed... hot weather + prolonged dry conditions, will impact food going forward. Even a change in diet will be hard to escape inflation, in my humble opinion. Food is a basic necessity.

Energy seems to be falling, but step away from gasoline for a moment and you realize that Electricity is rising and although Natural Gas slipped last month, expect a rebound going forward. The futures market says so.

Overall, energy is more about geo-political issues and demand/supply. Supply in some areas will continue to falter, while demand in others may slip. 

For the month...
  • All items, -0.5%
  • Food, +1.0%
  • Energy, -9.0%
  • All items less food and energy, +0.2%
One year...
  • All items, +9.8%
  • Food, +15.0%
  • Energy. +36.8%
  • All items less food and energy, 8.5%
There are many nuggets of information in the report, to fit whatever bias you may have.

The current state of July reports and releases (as always, the Eurostat/USA figure is my concoction based on the Eurostat formula)...


The upstream numbers are decreasing, but with PPI final demand at 9.8% and the CPI-U at 8.5%... I don't think inflation is quite done with us.

While you are enjoying your roasted coffee (-2.3% from June), please explain why corporate media is avoiding much discussion of this PPI release?😞


Review of March 2024 data, 1Q GDP, PCE and personal income

The monthly summary is not so wonderful, incomparison... Inside all that pink is some troubling food related issues. Even though energy is s...