Wednesday, August 31, 2022

Review of EIA Weekly Report for August 31st 2022

The EIA released the latest weekly report, and there is a continuing sliver of demand destruction. The numbers do seem to suggest it, although the day's supply of 24.3 from last week slipped to 24.2 on this week's report.

Gasoline Inventories slid -1.172M barrels from last week. That limited loss in day's supply was in spite of a healthy 3+MBbls of export more than import. Yet the prices continue to slip.

The market for gasoline is still declining, and looks to continue with this report. According the the AAA, the national average has slipped 4¢ from last week, and my guess... there is room for another 40¢, although weather may become an obstacle at this point. 

Speaking of weather, the models aren't showing anything of T.S. variety hitting the U.S. East or Gulf Coasts in the next couple of weeks. Keeping fingers crossed. 

Crude stocks fell 3.3M BBLS from last week and exports of crude and petroleum products outpaced imports by 14.4M BBLS. WTI is down about $5 from last week. Basically, back to where it was 2 weeks ago.

Diesel fuel continues to edge up, as the national inventory is -18% from year ago levels. 
Click to Enlarge

The situation is indeed dire on the East Coast, especially in New England, as well as the Central Atlantic. As I have stated elsewhere, much of this blame can be laid at the feet of certain folks in a place called Albany. Granted, future issues could be alleviated by Congress repealing the Jones Act... but fixing stupid is a whole other ballgame, imo.

Click to Enlarge
In summation, we have inventories falling, gasoline prices falling, Russia shutting Nordstream for a few days, and European and U.K. natural gas prices falling. Clearly, I do not have a handle on any of this... to understand the whys!

End of the month, and time to take a bit of a break... or maybe not!


Friday, August 26, 2022

GDP 2Q, 2022 2nd Est., PCE, Income and Outlays, Inflation Summary and Opinions!

The BEA released the 2nd estimate of GDP and it was revised to -0.6% annualized. You can read the link at your leisure. I am not going to yap about the data or the verbiage in the release. 

What did amaze me, was a ripple in the news about the trade deficit. Here is my updated trade deficit drag on GDP...

Click to Enlarge
The media has been reluctant to mention trade deficits, so it was a surprise to see it noted on my twitter feed. 6 straight quarters of record trade deficits to GDP and someone noticed. Also, the dollar rise seems to have awakened some, after 4 quarters of rises... amounting to 17.2% increase.

This was all yesterday's news, so onto the Personal Income and Outlays...
Personal income increased $47.0 billion (0.2 percent) in July, according to estimates released today by the Bureau of Economic Analysis (tables 3 and 5). Disposable personal income (DPI) increased $37.6 billion (0.2 percent) and personal consumption expenditures (PCE) increased $23.7 billion (0.1 percent).

The PCE price index decreased 0.1 percent. Excluding food and energy, the PCE price index increased 0.1 percent (table 9). Real DPI increased 0.3 percent in July and real PCE increased 0.2 percent; goods increased 0.2 percent and services increased 0.2 percent (tables 5 and 7).
Click to Enlarge
Note that June numbers were revised upward, 0.1% on the DPI and downward of PCE. In any case, the expenditures (PCE) is still outpacing the disposable disposable income (DPI). 

Here is a summary of various inflation gauges for July...
Click to Enlarge
It is impossible for me to finish without an opinion, although my opinion is sprinkled throughout.

As I have noted in previous articles, even the BLS stated the flat July reading was totally due to -7.7% change in gasoline prices. I would put the fall for August near the -10% range. It would seem the expectations would be for another flat month or possibly a negative print. 

But... the energy index was down last month -4.5%. There is more to energy than just gasoline as the rise in electricity was +1.9% and piped gas (N/G?) was down -3.9%. I would expect a continuation of electricity rises and a reversal of piped gas... back to increases. 

Also, the SPR release is set to halt at end of October, and OPEC is suggesting production cuts... to stabilize prices!

Diesel prices falling has shifted the past two days and is showing an upward tilt, as fall harvest is now beginning. Gasoline prices continue to fall, but we haven't had a storm in the gulf. Keep an eye on the tropics!  

Speaking of weather... food is rather dependent on the weather, with droughts inhibiting yields, and heavy rains disrupting both planting and harvesting. These weather occurrences are always an issue for someone, somewhere. The frequency and widespread occurrences, are troubling.

Fertilizer is also used to increase yields in crops, and are a global commodity. A lot of natural gas is used in the production of fertilizers. European producers of fertilizers are reducing and/or curtailing production of fertilizers... as natural gas prices have become to high to operate. 

Of course, that would be a European problem, except fertilizers are once again... a global commodity. Research phosphate, nitrogen, potash, anhydrous ammonia, etc. 

While LNG export is limited by infrastructure... these fertilizers are mostly not. So even if there is a good growing season, the cost of raising those crops will increase, due to fuel costs (diesel) and yield enhancing fertilizer.

The old adage "hope for the best, but prepare for the worst", comes to mind. Not that the worst will happen, but let's not become giddy over some short term positives about peaking inflation, etc. 

Or as Yogi said... "it ain't over, till it's over."

Wednesday, August 24, 2022

Review of EIA Weekly Report for August 24th 2022

The EIA released the latest weekly report, and there is a sliver of demand destruction. The numbers do seem to suggest it and the day's supply of 23.8 from last week has edged up to 24.3 on this week's report.

Gasoline Inventories slipped a mere -27,000 barrels from last week. That gain in day's supply was in spite of a healthy 2MBbls of export more than import

The market for gasoline is still declining, and looks to continue with this report. According the the AAA, the national average has slipped 6¢ from last week, and my guess... there is room for another 24¢, although weather may become an obstacle at this point. 

Crude stocks fell 3.2M BBLS from last week and exports of crude and petroleum products outpaced imports by 2.2M BBLS. WTI is up about $6 from last week.

Diesel fuel at the pump broke the string of price drops as of this morning. 

Click to Enlarge
The day's supply continues to slip in this category. 

Natural gas propelled upward, but is now falling back slightly. The Freeport restart has been moved back to November. 

Click to Enlarge
It has become popular to used the term Barrels of Oil Equivalent, so simply multiply the above dollar values X 5.8. You can then use whatever forex conversion method to achieve the price in your currency.

While most of my articles contain opinions, I will now vent...

Generally speaking, countries throughout the world and their lackeys (Media) point out the failures of someone else, to deflect problems within. It is sort of in the vein of "we don't have so bad, when you consider how things are in that other country."

The issue in Europe over natural gas prices, does not get a lot of mention in the U.S. mainstream media. I expect that to change as the talk surrounding electric bills and some 20M households are behind on those bills. 

While natural gas is nowhere as high in the U.S. as elsewhere... some things that pique my interest.

  • Natural gas is likely to surge come reopening of Freeport on November 1st..
  • 40% of U.S. electricity is derived from natural gas.
  • The SPR release is slated to end on October 31st.
  • OPEC is discussing a reduction of crude, to stabilize the market. 
  • Last month's CPI at 0.0% month to month will likely be repeat for August. Solely based on gasoline prices falling. (Nothing else) (The gasoline index fell 7.7 percent in July and offset increases in the food and shelter indexes, resulting in the all items index being unchanged over the month. - BLS)
  • Electricity and N/G are up 15% and 30% from last year, and rising fast.
  • Food prices have not indicated any moderation of prices.
  • There are already 20M households behind on energy bills.
I have no doubt, that by January, the European issues with heating, economy, etc. will be a daily feature in U.S. media. Conversely, European media will no doubt be talking about the dire situation of poor Americans. 

It's all deflection from misery in the home country, imo.  

One other note, the gasoline index appears to be headed for a near -10% fall from July, yet the all items index, will likely be 0.0%. The fall in gasoline is masking inflation in other areas.

Not sure what the winter weather forecast might be, but morale might be dark and gloomy in many areas.

Thursday, August 18, 2022

Where do we stand on Natural Gas and European Inflation.

Are we looking at the wrong stats to determine whether we will have a recession in the U.S.? Slowly, concern for China's economy has edged into the picture, but not much is being said about Europe. 

Frankly, I don't see how Europe can avoid a recession and I wonder how that will impact the U.S. It is clear for all to see, the impact of natural gas will have on Europe. These aren't small numbers.

When you hear reports of the U.K. raising the cap to £4,200 annual, it might be overlooked that in early summer of last year... it was about £1,200 annual. Currently the cap is about £2,000 annual. Here is the latest futures, converted to USD...

click to enlarge
Inflation in Europe is edging up, even while the governments are trying to keep a lid on the natural gas impact to consumers. 
click to enlarge
Maybe a chart would be better...
click to enlarge
Generally speaking and from I can glean... the German natural gas storage is 78% of capacity, with a goal of 90%... just to get through this winter and then the cycle continues. The U.K. is near capacity and is using its LNG facilities to export to Europe. As winter nears the expectation is for U.K. prices to soar to that £4,200 annual.

Considering that not long ago, Asia was the recipient of one half of LNG. They are being subjected to very high LNG prices as well.

The U.S. is not immune to upward natural gas prices, but not to the extent of Europe. The recent CPI report seems to have somewhat mirrored the ebb and flow of Nat/Gas prices, but the ebb may be over, as the flow via LNG, is set to restart with Freeport and where there is money to be made... more facilities will come on line. Drawing against U.S. reserves. 

It was Freeport going off line, which created the dip, as the draw on reserves slowed.
click to enlarge
https://www.eia.gov/naturalgas/weekly/#tabs-prices-3
While this chart indicates some slipping in July, due to Freeport being offline, the current NatGas price is about $9 and expected to continue climbing as LNG exports pick up. While Freeport is not slated to come back on line until an October restart... the draw has begun.
Month to Month
click to enlarge

That July drop will reverse in August.

And it should not go unnoticed... electricity prices have been on a steady upward swing, which with about 40% of our electricity coming from natural gas generation. Winter is nigh upon us. Gasoline may be ebbing (?), but the rest of the overlooked energy index is not, and it will likely be overlooked until those heating bills come into play.

We have gotten rather used to cheap natural gas and those days are in the rear view mirror, imo. So what are natural gas stocks for the U.S. compared to last year.
click to enlarge
https://www.eia.gov/naturalgas/weekly/
3375Bcf last year to 2519Bcf this year, or down 25.3%. Certainly within the 5 year average, but only 119Bcf above the minimum.

Let's hope for a very mild winter.


Wednesday, August 17, 2022

Review of EIA Weekly Report for August 17th 2022

The EIA released the latest weekly report, and I am still not seeing demand destruction. Yes, from this time last year, but it is hard to make a call on demand destruction, when the days supply of gasoline falls from 24.9 last week, to 23.8 for this week's report. 

Yes, Gasoline Inventories fell 4.6M BBLS from last week's report. Might the imports/exports of gasoline have something to do with that. We did export 1.3M BBLS more than import... last week. I am not sure where all those numbers citing demand destruction are coming from. 

The market for gasoline has shot up 2¢, as of this writing. That is down from last week, by about 14¢. Still,  NOT seeing demand destruction. Crude stocks fell 7M BBLS from last week and exports of crude and petroleum products outpaced imports by 19M BBLS. WTI is down about $5 from last week.

Somehow, someone, somewhere... demand is still there, although the pricing isn't. A very mixed message, as far as I am concerned. 


I keep hearing how crude and gasoline demand are falling. Then I hear how the inventories are falling and prices should go up for crude and gasoline. Somewhat contradictory and appears mostly false.

A week ago, the stock market ,said to be anticipating a more dovish stance, based on cooling inflation numbers and as a result... rallied. Today, the FED minutes suggest a dovish stance and the market is slipping. 

I have come to the conclusion that I am not alone... in not knowing what is going on. 

Retail Trade Report for July 2022

The Census Bureau released the Advance July Retail Sales Report, this AM.

Advance Estimates of U.S. Retail and Food Services

Advance estimates of U.S. retail and food services sales for July 2022, adjusted for seasonal variation and holiday and trading-day differences, but not for price changes, were $682.8 billion, virtually unchanged (±0.5 percent)* from the previous month, but 10.3 percent (±0.7 percent) above July 2021. Total sales for the May 2022 through July 2022 period were up 9.2 percent (±0.5 percent) from the same period a year ago. The May 2022 to June 2022 percent change was revised from up 1.0 percent (±0.5 percent) to up 0.8 percent (±0.2 percent).

Retail trade sales were virtually unchanged (±0.4 percent)* from June 2022, but up 10.1 percent (±0.7 percent) above last year. Gasoline stations were up 39.9 percent (±1.6 percent) from July 2021, while nonstore retailers were up 20.2 percent (±1.2 percent) from last year.

On my very unscientific graph, the impact with CPI inflation backed out of the numbers.


Still not seeing that demand destruction that I would expect to see for a recession. Looking at the winners and losers, seems to confirm that notion.
We should be aware of the ongoing issues with the auto industry and even a minimal user of gasoline, such as myself, would know the pump prices are falling.

The non store retailers, which would include mail order, etc. is up, and building material, garden equipment, etc. is also up. Somehow, I would expect these two to slip a bit, if a recession were taking place. 

Granted, I have know idea where the money is coming from, to continue this level of spending, and would not have an idea of when it might end. I can only speculate, it might slow in the coming months. Of course, a simple explanation would be the savings from the pump are being redirected.

That speculation is simply based on the uneasy feeling that winter heating and electric bills will offset the gains at the gasoline pump. I will attempt to delve into that worrying trend in the next couple of days. 

Saturday, August 13, 2022

Is It Still Too Early to Predict C.O.L.A.? And Some Other Observations...

I've had to revise downward, my previous forecast... by quite a bit. I am okay with that, as longing for inflation to continue upward, with the hopes of a higher check in the future... seems rather silly, imo.

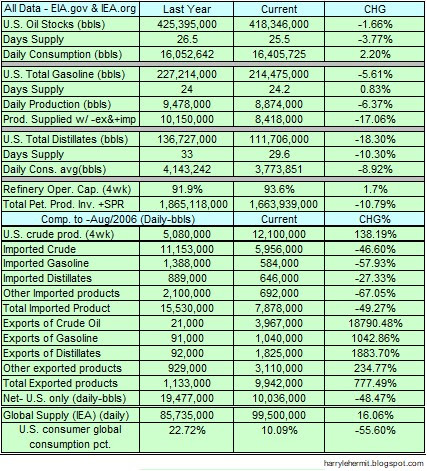
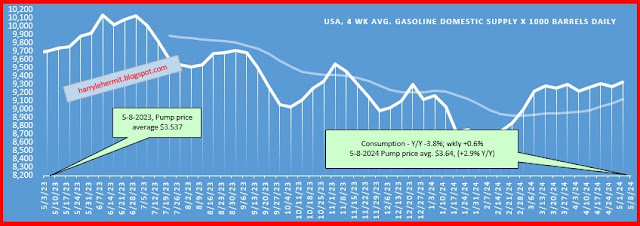
While headline CPI was 0% for the month to month, the CPI-W declined -0.1%. Both were largely a product of the decline in energy, specifically gasoline. Gasoline has already fallen on this date, by similar numbers as July. Which will be more than enough to offset the rise in groceries (more later on groceries). Gasoline should fall a bit further over the next week, but seems to be set to stabilize.

It might even offset any expected increases in "core" inflation. My August projection in the chart is for a range of -0.2% ~ +.01% month to month for CPI-W.  September CPI-W ranges from -0.3% ~ 0.0%. So while the chart plots the C.O.L.A. increase range as 8.6%~9.0%, the lower number is much more likely, imo.


So call me suspicious of "non-partisan" groups that have headlined the potential for 10%+ S.S.A. C.O.L.A. and their adoring "journalists" that published this information for seniors on Social Security to read. To get 10%+, you have to have at least one month above 10% and likely 2. We haven't had even one

It does make me wonder what the aim of those "reports" were? Further divisions? Which brings me to politics. One side of the aisle plays up the 0.0% change in M/M and the other side reminds us, it is still 8.5% Y/Y.

I may sound like the latter, given what I am about to say. But first, another chart (BLS sourced, except projections)...
When I earlier mentioned a near repeat of July's numbers for August, I was not kidding. Which brings me to food... something I rather enjoy. It also brings up the looming food insecurity and a phenomena called "hangry" . The latter of which is a smash-up of hungry and angry.

August's food at home will most likely be +14.3% Y/Y. How can I say this? This is the PPI (BLS) from July and while it was down -0.5%, that did not mean everything went down. NO! It did not!


Somehow I believe, some of this will get passed on. It is already an issue on the websites I frequent, just as gasoline prices were. Were, as in it has shifted to lower pump prices, but still unhappy, as it isn't what it was 1 year or 2 years ago. So remember the 2.0% finished consumer goods, one month jump of the PPI. It is coming to a home near you.

Food is becoming more and more the topic, with many expressing some form of hardship. What intrigues me, is they are still hanging on to their smart phones, internet connections, etc. 

However, there are people that either haven't had any of those items or have had to cut back. People do change their spending habits for one reason or another, but keeping food on the table is rather constant, imo. 

I am referring to the USA in this instance, as I cannot imagine the hardships being foisted on a large swath of the population in Europe. And as food is a global commodity... the rest of the world as well. Seriously, I cannot fathom what it is like in some areas of Africa where food scarcity is the issue.

Food scarcity... lack of basic nutritional food.
Food insecurity... inability to afford basic nutritional food.

We have enough angry people in the USA, without increasing food insecurity and making even more people angry or hangry

Which goes to show a tried and true historical method is once again being used. Our "elected leaders", "corporate masters", and their "media shills" must ensure we are blaming each other, rather than focusing on the real problem... which is "them".

I'm sure we will be informed how things are "looking up" or the "sky is falling". Most likely all spin, just like water circling the drain.  

Whew! I got that off my chest! Time for a nap?


This Week in Petroleum Summary May 8th, 2024 per EIA.GOV

This week's  full report . Gasoline fell -2.3¢ for the week, but remains +10.3¢ from year ago level. Consumption did edge up this past r...