Thursday, December 29, 2022

Crude, Distillate, and Gasoline Inventories - Dec. 29th 2022

Weekly EIA report.

Crude stocks went up 718K barrels, from last week; Distillates up 283K Barrels; and Gasoline slid -3.1M barrels. The SPR slid another -3.5M barrels.

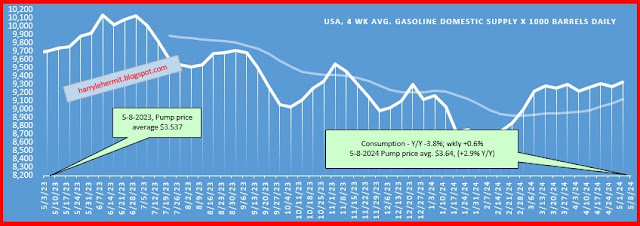
Inexplicably, gasoline consumption within the U.S., has risen for 2 consecutive weeks. This report is through 12-23, so the impacts of the winter storm would not be fully reflected in these numbers. Although there are people, such as myself, that made sure the tank was topped off.
The national average, per AAA, has risen +5.8¢ the past week. How much is due to the winter storm and refinery struggles... not really sure. There is a slight upward bias in gasoline pump prices.

Distillate stocks continue to slip in the New England region. Again, this data was pre blizzard and the blast of cold arctic air. 

A month ago, the news out of New England was dire, in regards to heating fuel and natural gas. 

On a side note, I was once an avid UK Wildcat BB fan, but slowly discontinued my allegiance, when the marketing major shifted the brand= to Cal's Cats. Last night, I decided to check out some twitter feeds about them and somehow the Twitter algorithm thinks I am once again an avid fan. Geez!


Saturday, December 24, 2022

Natural Gas Report, Dec. 24, 2022

The Energy Information Administration released their weekly report Thursday, and I am just now getting around to commenting, and given the current climate, could be old news.

Such as the latest storage being from 12-16.

This paints a picture of almost normal for everywhere, except the West Coast. It will be a couple of reports, before a clearer picture of this current winter storm's impacts. BUT, the futures market seems to be ignoring these storms. Possibly due to the short duration. It's hard to believe, but temps will rebound to normal and above normal temps... by New Year's.


The futures market has dropped from last week. And I do mean... massively dropped. Why? Supply outpacing demand, would be one explanation... but why? Until I can grasp the why, I have to believe a rapidly slowing demand is the reason. Again... why?

I am talking about storage levels and demand to refill. The answer seems kind of obvious, when considering inventory levels and demand. It is likely felt that we have enough in storage to withstand this winter's demand, which means a lowering of stocks going into summer. 

That would be the normal cycle, except... what about next winter and the build of inventory?

I guess we should enjoy this while we can. Consider it the calm, before the next storm!

Wednesday, December 21, 2022

Crude, Distillate, and Gasoline Inventories - Dec. 21st 2022

Weekly EIA report.

Crude stocks slid -5.9 M barrels, from last week; Distillates slid -242K Barrels; and Gasoline increased +2.5M barrels. The SPR slid another -3.6M barrels.

Refining operation eased this past 4wk. average, although gasoline supplies increased. The loss seems to be in distillates. 

Gasoline consumption ticked up this week by 1.0% from last week after a month of declines. It is currently at -8.2% compared to same time last year. Gasoline, according to AAA, has declined -10.6¢ from last week. 


Diesel in New England, still remains on the low side and is declining from last week. This cold snap will change the numbers, imo. 

Not sure if gasoline prices will continue to slide, or when the draw on SPR numbers will stop, etc. 

Thursday, December 15, 2022

Natural Gas Report, Dec. 15, 2022

The Energy Information Administration released their weekly report today...

Continues to hold inventories above mid range of 5 year maximum and minimum. Regionally... a bit different story...
Mountain and Pacific regions experienced some drops, week to week and down from one year ago. That storm hitting into the west, is now moving hard into the east, so I would expect some drops in more regions on next week's report.

Overall, prices have edged up on UKG and TTF, with U.S. futures jumping about 9.5%.
Overall, that percentage is still in a rather narrow band, as is UKG and TTF. Forward looking, does not see an let up, as EU and UK reserves will likely be quite slim, by spring. A lot of Russian natural gas was used to build up those reserves, prior to NordStream being curtailed and then shut down. 

Not sure who will fill that gap in the 2023 runup to next winter. I would expect U.S. natural gas prices to shoot up during this period, as more LNG Tankers and Processing capacity comes on line. Then there is the matter of Russian LNG, which is still getting to the market, and quite possibly more than what the U.S. is shipping. Highly likely, it is more. 

While that might infuriate some, it would ease the run up of prices in U.S. Natural Gas.

Take your pick!

What To Make of the November Retail Trade Report

ADVANCE MONTHLY SALES FOR RETAIL AND FOOD SERVICES, NOVEMBER 2022 

Advance estimates of U.S. retail and food services sales for November 2022, adjusted for seasonal variation and holiday and trading-day differences, but not for price changes, were $689.4 billion, down 0.6 percent (±0.5 percent) from the previous month, but up 6.5 percent (±0.7 percent) above November 2021.

Total sales for the September 2022 through November 2022 period were up 7.7 percent (±0.5 percent) from the same period a year ago. The September 2022 to October 2022 percent change was unrevised from up 1.3 percent (±0.2 percent).

Retail trade sales were down 0.8 percent (±0.5 percent) from October 2022, but up 5.4 percent (±0.7 percent) above last year. Gasoline stations were up 16.2 percent (±1.6 percent) from November 2021, while food services and drinking places were up 14.1 percent (±3.0 percent) from last year.

The biggest losers for the month...
  • Department stores
  • Furniture & home furn. Stores
  • Motor vehicle & parts dealers
  • Building material & garden eq. &
  • Electronics & appliance stores
Moderate Losers for the month...
  • Non-store retailers
  • Sporting goods, hobby, musical instrument, & book stores
There seems to be a bit of concern, as the sales rate fell more than anticipated. How much is seasonal and how much is consumers pinching pennies? 
  • We knew, or should have known, that Motor Vehicles were slowing, especially in the used car market, with lower prices. 
  • Building materials, etc. would seem likely to slip this time of year.
When we consider this release as being current dollars and then adjust for real dollar purchases... the line has been fairly flat for several months. Compared to last year in "inflation adjusted" dollars, this month is -0.2%. 
Of course, we must always remember that data may be adjusted in following months, as more data becomes available. So everything I have mentioned is based on incomplete data. Not very helpful, in my humble opinion, but the best available information. 

I don not understand the hoopla around this report. 

Wednesday, December 14, 2022

Crude, Distillate, and Gasoline Inventories - Dec. 14th 2022

Weekly EIA report.

Crude stocks rose 10.2 M barrels, from last week; Distillates increased another +1.3M Barrels; and Gasoline increased +4.5M barrels. The SPR slid -4.8M barrels.

Refining continues at a high rate of efficiency, as the inventory gasoline, distillates, etc. continued to grow. Even in spite of continued high exports of gasoline. Gasoline consumption slipped -9.5% from year ago levels on the 4 week average and another -1.8% from previous week's average, to a level of last February.
Pump prices continue to fall and might just make that $3 national average at Christmas. However, I may just fill up the tank this weekend, as I think the floor is near in regards to that national average, in my humble opinion. ($3.08? Which is 13¢ above my estimate last week)
The overall is in decent shape, year over year, but a couple of areas are still under stress. While I am not showing a graph of the significant drop in distillate consumption, it does raise the question of why is both gasoline and diesel consumption dropping so much in December, instead of the usual late January to February slump?

Along with that thought, is the impact energy has on the overall inflation picture and what happens when it bottoms and begins to rise again? But then, why is it falling so much at this point? Lower consumption? Great, but why?

I always hear about how the FED watches this report, or that report, etc. I found it odd, that no mention was made of the FED's own Median CPI. It was 7.0%, year over year, just like last month. NO CHANGE! Am I believe the FED creates a report, that they do not watch?

I have so many questions.

Tuesday, December 13, 2022

CPI DATA and Real Earnings, December Reports 2022

The BLS report was released this morning and it was a surprise. (historical releases) It came in substantially under the forecast by everyone.

Last month, I projected this...

Range of 7.6%~7.9%. Sure things are moderating, but can we count on further reductions in Electricity, Utility (piped) gas service, apparel, Used cars and trucks, and Medical Care services? 

The answer to the question is yes. 

The Consumer Price Index for All Urban Consumers (CPI-U) rose 0.1 percent in November on a seasonally adjusted basis, after increasing 0.4 percent in October, the U.S. Bureau of Labor Statistics reported today. Over the last 12 months, the all items index increased 7.1 percent before seasonal adjustment.

The index for shelter was by far the largest contributor to the monthly all items increase, more than offsetting decreases in energy indexes. The food index increased 0.5 percent over the month with the food at home index also rising 0.5 percent. The energy index decreased 1.6 percent over the month as the gasoline index, the natural gas index, and the electricity index all declined.

The past 5 months (June to November) has been at an annualized rate of +1.13%. For comparison, the previous 5 months of January through June was an annualized rate of +12.94%. A major improvement in inflation, although it could be due to lower demand. Have to wait and see. 

For the first time in quite a long time, my monthly change was negative. Using the aforementioned 5 month ranges, the last 5 months was at annualized +1.41%, compared to prior 5 month annualized, of +10.94%. For year over year, My CPI stands at +6.7%

Hourly earnings have just about caught up with pre covid earnings. Real Earnings

I have done such a bang up job on predictions, I will not make any bold predictions for the future, although significant easing of energy prices is underway... although I suspect that might come to an end very soon. 


This Week in Petroleum Summary May 8th, 2024 per EIA.GOV

This week's  full report . Gasoline fell -2.3¢ for the week, but remains +10.3¢ from year ago level. Consumption did edge up this past r...