Wednesday, November 22, 2023

My electricity bills over time (January 2017~ November 2023)

Once again, I monitor my residential electricity costs.


As always, weather is a factor in consumption, which is why a rolling average is also important. Currently, that 12 month rolling average is -2.4% below last year. 
[I suspect it might continue to be lower, as I altered the thermostat settings in December of 2022. I adjusted the nighttime heating settings from 68°F to 72°F, which would increase the usage in winter time. Daytime heat settings remained at 72°F.

Cooling settings remain at 76°F daytime and 72°F for nighttime. Additionally, the number of days between meter readings vary.]
Currently, the 2023 average is below last year. Also, it should be noted that year over year... or base effects come into play, which tends to hide the overall increases. 

So what might seem like good news, still carries quite a bite on the budget. The CPI-U suggests that the average consumer spends about 2.559% of their expenses on electricity... or about $150 per month. 

My average is significantly short of that dollar amount, percentage wise. However my electricity expenses, compared to overall expenses, is well north of 2.559%. Which means other items in the expenditure basket are constrained.

While it (electricity costs) might end up being below last year, the cost of that electricity  has surged 10.2% since February, 2021. I don't expect it to fall back to levels of that time. 


This month's bill, is the lowest in this range, but the billing month was for a mere 24 days. 466 KWH was usage, so 13.65¢ per KWH. Last month was 33 days, at 13.7¢ per KWH.

A Foray into the 2024 Presidential Election, Part One

I can't resist the notion of commenting on the 2024 Presidential election.

First off, I fully expect democrats to vote democrat and republicans to voter republican... regardless of the candidates nominated.

The independents seem to matter most... in these elections.

One thing that might be overlooked, is that polls the past two presidential elections were off. Everyone knows that, but the oddity... the polls seem to overstate the democrat candidate and understate the republican candidate. 

You can check, but this is across all states, as well as nationally.

Here is a sampling from 2020...

So when claiming polls are incorrect... you are right, but maybe not in the direction you would hope.

A bit of history...

In 2016, the election was up for grabs in so called battleground states. 


The most often mentioned states, were Pennsylvania, Michigan and Wisconsin. That would be rightfully so, as they were supposed to be blue, yet somehow turned red, along with their 46 Evs. If they had been flipped, then Clinton would have been elected.

Those 3 were supposed to be safe states, yet became "battleground" as the 2016 election approached. Michigan and Pennsylvania last voted republican in 1988. Wisconsin in 1984.

A mere 77,736 combined votes was the difference in that election.

On to 2020...

The surprises here were Georgia (16); Arizona (11). Pennsylvania, Michigan and Wisconsin flipped back to Blue. 72 electoral votes in those 5 states. 22,236 votes in Georgia and Arizona, then add in Michigan's 154,181; Pennsylvania's 82,166 and Wisconsin's 20,682 for a total of 279,265.

Georgia was reliably republican since 1996. Now they are in the battleground group as well.

Of note, Wisconsin's 20,682; Arizona's 10,457; Georgia's 11,779, would have really knotted up things if voting the other way. 269~269. That would have been interesting. 42,918 voters decided the presidential election.

Now for 2024...

I'm keeping the same set of battleground states, although why states such as Iowa, Colorado, Ohio and Virginia keep cropping up, remain a mystery.

Obviously, this is based on current state polling, where available. I deem Colorado and Virginia as being blue, without further research. Ohio and Iowa are certainly Red, without further research. 

Trump leads in Arizona, Nevada, Pennsylvania, and Wisconsin... but is within the margin of error.
Trump leads in Florida, Georgia, Michigan, and North Carolina... above all margins of error.

While the Michigan numbers seem to indicate a wide margin in favor of Trump, I would question that... based on recent events. Sure, a certain group is screaming at Biden, but favoring Trump in a meaningless poll, may not translate to the voting booth. The potential does exist of that group staying home on election day. They may be upset with Biden, but I refuse to believe they would vote for Trump.

Basically, 46 EVs are trending towards Trump, but within that statistical margin of error. That puts Trump currently polling 263 Evs outright, versus 229 for Biden.

This is what has the Democrats running scared and also... keeping Trump in the race. 

What is peculiar, is when Haley is thrown into a head to head match up, those within margin states becomes much wider. The Trump camp, will not like that, but the devil is in the details. Yet, Trump crushes Haley in primaries.

It would appear to this completely untrained eye, that Democrats desperately need Trump to be the Republican nominee. The Trumpers are clearly more interested in Trump being president, than a republican being president.

I guess you could say the democrats and trumpers are united in discouraging any other republican candidate. 

Of course, the republicans are united in removing Biden and... it should be noted, that certain democrats are kinda wishing and hoping Biden would step aside.

(See... it is not all divisive politics!) 😉

Of course, things might improve and the storm weathered. Which is what it boils down to, as there is NO ONE in the democrat wings that can realistically step up. 

You know its not Harris, and you might be delusional... if you think Newsom.

My blurb from March still largely holds true. 


Saturday, October 21, 2023

There Is More Than the National Debt to Worry About!

 I keep reading about the national debt, then consumer debt, etc. 


I probably should worry, but I am getting up there in years, so I find it hard to worry too much about things in the future... I have no control of.

A few things that seems to be overlooked, are corporate debt, municipal and state debt. 

When the time comes for corporate debt to be rolled over, the interest rates will certainly weigh on earnings. Fine, they can raise prices... if the consumer market will bear the increase. I won't even bring in the topic of new debt, to finance some innovative product or expansion. That will also cost more in interest. 

Of course, we have state and municipal debt. In most of these cases a balanced budget is required. Any additional costs due to increased debt service, whether from roll over bonds or new bonds, must be budgeted... and the budget must be balanced.

Of course, newer sources of revenue will be sought (new taxes) as well as potential increases in taxes.

I'm sure the consumer will gladly pay for this, just as they will merrily pay for corporate price increases. 

Soooo... when your eyes roll and cloud up over discussion of treasury rates and home interest rates, don't forget the host of other things happening. 

Everybody is borrowing and you wonder who might be paying. Open your eyes... you know the answer.

PAY ATTENTION!!!

Tuesday, October 17, 2023

10-17-23, Advance Retail Sales Report for September Data

Advance Monthly Sales for Retail and Food Services, September 2023

Advance estimates of U.S. retail and food services sales for September 2023, adjusted for seasonal variation and holiday and trading-day differences, but not for price changes, were $704.9 billion, up 0.7 percent (±0.5 percent) from the previous month, and up 3.8 percent (±0.7 percent) above September 2022. Total sales for the July 2023 through September 2023 period were up 3.1 percent (±0.4 percent) from the same period a year ago. The July 2023 to August 2023 percent change was revised from up 0.6 percent (±0.5 percent) to up 0.8 percent (±0.1 percent).

Retail trade sales were up 0.7 percent (±0.5 percent) from August 2023, and up 3.0 percent (±0.5 percent) above last year. Nonstore retailers were up 8.4 percent (±1.6 percent) from last year, while food services and drinking places were up 9.2 percent (±2.3 percent) from September 2022.

As always, a reminder... "not for price changes", means not adjusted for inflation.


The term "resilient" continues to be overused, when clearly the actual "stuff" being bought is rather stagnant. 

That's not to say that last month's data was not an improvement, as both month to month and year over year were up... after adjusting for inflation. However, a rolling 12 month average indicates slippage of -0.1%, when adjusted for inflation.

That includes last September, which got revised downward... ever so slightly.


It should be noted, that today's report is +1.8% above January in current dollars, yet -1.1% when inflation adjusted. THAT is after all the revisions to January. Which begs the question... what will next month's backward revisions be.

You won't hear about it, as the mantra... "if it can't be spinned positively, ignore it." I am not saying the Census Bureau minions are at work here, but politicians and their friendly media darlings do.

I will continue to monitor thee monthly reports, however this is the last in this series.

Thursday, October 12, 2023

BLS Data Dump. CPI - October 12, 2023

First up is the BLS Report for CPI...(historical releases)

The Consumer Price Index for All Urban Consumers (CPI-U) rose 0.4 percent in September on a seasonally adjusted basis, after increasing 0.6 percent in August, the U.S. Bureau of Labor Statistics reported today. Over the last 12 months, the all items index increased 3.7 percent before seasonal adjustment.

The index for shelter was the largest contributor to the monthly all items increase, accounting for over half of the increase. An increase in the gasoline index was also a major contributor to the all items monthly rise. While the major energy component indexes were mixed in September, the energy index rose 1.5 percent over the month. The food index increased 0.2 percent in September, as it did in the previous two months. The index for food at home increased 0.1 percent over the month while the index for food away from home rose 0.4 percent. 

The index for all items less food and energy rose 0.3 percent in September, the same increase as in August. Indexes which increased in September include rent, owners' equivalent rent, lodging away from home, motor vehicle insurance, recreation, personal care, and new vehicles. The indexes for used cars and trucks and for apparel were among those that decreased over the month.

I had readings of 3.6%~3.9%, so the 3.7% was within that range.

The past 12 months...

My own CPI...
The C.O.L.A. was announced at 3.2%.

The results, compared to average S.S. income and various CPI methods. Once the average monthly S.S. is adjusted for Medicare Part B, the result is 2.9%.

Then compare the average 3 month of each CPI method, yields the headline CPI of 3.5%; Chained CPI at 3.6%; R-CPI-E at 4.1%; the end result of S.S. monthly minus projected Medicare part B... stands in sharp contrast to actual inflationary pressures.


'Nuff said!

This concludes my monthly publication of CPI.


BLS Data Dump. Real Earnings - October 12, 2023

The BLS has released the latest Real Earnings Report.

Real average hourly earnings for all employees decreased 0.2 percent from August to September, seasonally adjusted, the U.S. Bureau of Labor Statistics reported today. This result stems from an increase of 0.2 percent in average hourly earnings combined with an increase of 0.4 percent in the Consumer Price Index for All Urban Consumers (CPI-U).

Real average weekly earnings decreased 0.2 percent over the month due to the change in real average hourly earnings combined with no change in the average workweek.  

Real average hourly earnings increased 0.5 percent, seasonally adjusted, from September 2022 to September 2023. The change in real average hourly earnings combined with a decrease of 0.6 percent in the average workweek resulted in a 0.1-percent decrease in real average weekly earnings over this period.

I added emphasis to the decrease.

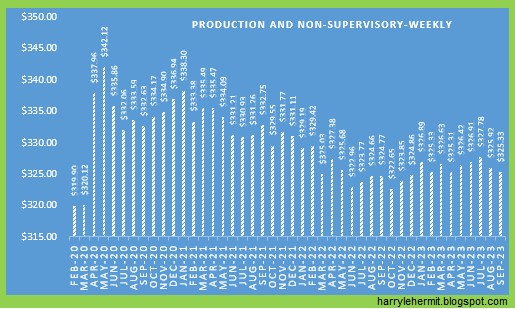
Graph time...


I suppose the good news... the Real Hourly is still +2¢ above pre covid, and down -2¢ from last month.

Real Weekly is +$2.08 above pre-covid, but down -71¢ from last month, AND... down -$1.10 from July.


The working stiffs are 14¢ above pre-covid on an hourly basis, yet down -1¢ from previous month, as well as down -7¢ from July.


The working stiffs are $5.43 above pre-covid on a weekly basis, yet down -59¢ from last month, and down -$2.45 from July.

The bad news, is all areas had a setback in inflation adjusted earnings in September. Let's hope that does not continue.

This closes out my publication of this data, although I will continue tracking. I'll just keep my thoughts to myself... unless I can't help myself.


Wednesday, October 11, 2023

Producer Price Index October release with September 2023 Data

The BLS has released the September Producer Price Index Report (historical releases) 

The Producer Price Index for final demand increased 0.5 percent in September, seasonally adjusted, the U.S. Bureau of Labor Statistics reported today. Final demand prices rose 0.7 percent in August and 0.6 percent in July. (See table A.) On an unadjusted basis, the index for final demand advanced 2.2 percent for the 12 months ended in September, the largest increase since moving up 2.3 percent for the 12 months ended in April. 

Leading the increase in the final demand index in September, prices for final demand goods rose 0.9 percent. The index for final demand services advanced 0.3 percent.

Prices for final demand less foods, energy, and trade services increased 0.2 percent in September, the fourth consecutive advance. For the 12 months ended in September, the index for final demand less foods, energy, and trade services moved up 2.8 percent.


As is often the case... there were revisions to previous month's data, so don't be surprised if this month's data is revised next month. The size of July's data was a bit surprising however. When that data came out, it was considered above expectations at +0.3%. A couple of month's later, it was revised to +0.6%, without any discussion.


In any case, I will continue to track, but this should wrap up publishing my thoughts.


This Week in Petroleum Summary May 8th, 2024 per EIA.GOV

This week's  full report . Gasoline fell -2.3¢ for the week, but remains +10.3¢ from year ago level. Consumption did edge up this past r...