Showing posts with label inflation. Show all posts

Wednesday, January 17, 2024

1/17/2024, Advance Retail Sales Report for December Data

Advance Monthly Sales for Retail and Food Services, December Report.

Advance estimates of U.S. retail and food services sales for December 2023, adjusted for seasonal variation and holiday and trading-day differences, but not for price changes, were $709.9 billion, up 0.6 percent (±0.5 percent) from the previous month, and up 5.6 percent (±0.7 percent) above December 2022. Total sales for the 12 months of 2023 were up 3.2 percent (±0.4 percent) from 2022. Total sales for the October 2023 through December 2023 period were up 3.9 percent (±0.4 percent) from the same period a year ago. The October 2023 to November 2023 percent change was unrevised from up 0.3 percent (±0.3 percent)*.

Hmmm...  "Total sales for the 12 months of 2023 were up 3.2 percent (±0.4 percent) from 2022." The BLS listed that same period as having inflation of 3.4%. Which means the seasonal variation and trading-day differences have come into the equation. Otherwise, sales were up a bit more than indicated, imho.

First up the revisions...


We continue a pattern of previous months being revised downward, so the monthly changes are somewhat suspect.

When adjusted for inflation, the annual shows an improvement of +2.2%. The January numbers will be quite interesting, imho. The January report, adjusted for inflation, is slightly above the December number with inflation adjustements. Revisions will likely take place. 😒

The inflation adjusted chart looks like this...


The quantity of goods has not yet matched the highs of both March and April of 2021 and 2022. It will be interesting to see if a seasonal repeat is in store for early spring.

Mail order, vehicles and general merchandise led the way, with $4.305M of the $3.909M increase. That means there were some losers. Gasoline was down -$691M. The rest were slightly above or slightly below.

Seasonal factors likely drove the mail order and general merchandise, so can't reasonably expect a repeat in January. Gasoline currently remains relatively flat, compared to December.

Like I said... the revisions for January's report should be very interesting.

Friday, January 12, 2024

Producer Price Index January release December 2023 Data

The BLS has released the December Producer Price Index Report (historical releases)

The Producer Price Index for final demand fell 0.1 percent in December, seasonally adjusted, the U.S. Bureau of Labor Statistics reported today. Final demand prices moved down 0.1 percent in November and 0.4 percent in October. (See table A.) On an unadjusted basis, the index for final demand rose 1.0 percent in 2023 after increasing 6.4 percent in 2022.

If the PPI is really a forerunner of consumer inflation, then CPI should continue to ease, as PPI has nearing same rate as CPI in the periods outlined below.


I would hope the drops in food and energy will continue, or at least stabilize. I suspect energy will creep up in the coming months, as this is a seasonal lull, according to previous December reports. Those same reports suggest a seasonal lull for foods.

I guess it is important to find the good news and celebrate... however fleeting it might be.

Thursday, January 11, 2024

BLS Data Dump. CPI - January 11, 2024

First up is the BLS Report for CPI...(historical releases)

Not sure what the hoopla is about, regarding coming in hotter than expected. Factoring the rounding, it was just a few basis points above my expectations.

The index for shelter continued to rise in December, contributing over half of the monthly all items increase. The energy index rose 0.4 percent over the month as increases in the electricity index and the gasoline index more than offset a decrease in the natural gas index. The food index increased 0.2 percent in December, as it did in November. The index for food at home increased 0.1 percent over the month and the index for food away from home rose 0.3 percent. 

I highlighted a portion of that statements, as it is weird as heck. Gasoline in the November report was 297.598 and December gave a 280.289. Granted that is "unadjusted", but seriously... where did the increase in gasoline index come from? Nationally, the prices are down from last month, about 18¢ and down about 9¢ from December of 2022. Yet, somehow the "seasonally adjusted" edged up enough to offset something else.

Even by the BLS numbers from December, 2022... gasoline fell -1.5% (unadjusted)  on the month and was -9.4% on the seasonal adjustments. December, 2023... saw gasoline fall -1.9% on the unadjusted monthly, ... but rose +0.2 of the seasonal adjustments.  

In any case, the top number has decreased for 3 consecutive months. Now that would be seasonal, as November and December of 2022... saw decreases. It reversed in the January 2023 report.

My own personal CPI looks like this...
That is a +2.2% increase annually, and +0.1% for the month.

As for Real Earnings.


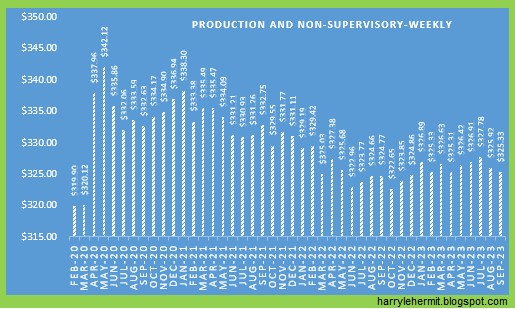
Remember when covid disrupted everything and massive shutdowns, layoffs, etc. Comparing that $380.95 real weekly earning, compared to February, 2020's $378.92. 

It is better than nothing!

Wednesday, December 20, 2023

Comparison of Inflation in selected countries- December, 2023 Edition

With the United Kingdom, Canada and EUstats release of November data, I have updated my comparison graph. [Note, the USA(EU method) is directly from Eurostat.]


For those individuals unable to think on their own and unable to question their masters, here is a timeline in rebuttal to the everyone has inflation. Look at the above chart to consider the timeline and now look at the below chart...


The EU method of calculating inflation is used, to better gain an apples to apples comparison. Yes, that line on top is U.S. inflation running well ahead of the EU and UK, or (sadly) what the your masters consider the rest of the world in U.S. political speak.

Geez!!!


Thursday, December 14, 2023

My electricity bills over time (December 2023 Edition)

It's December and the monthly bill has arrived.


As always, weather is a factor in consumption, which is why a rolling average is also important. Currently, that 12 month rolling average is -2.4% below last year. 
[I suspect it might continue to be lower, as I altered the thermostat settings in December of 2022. I adjusted the nighttime heating settings from 68°F to 72°F, which would increase the usage in winter time. Daytime heat settings remained at 72°F.

Cooling settings remain at 76°F daytime and 72°F for nighttime. Additionally, the number of days between meter readings vary.]

The conclusion at this point, is this year's electricity bill is running -2.7% below last year. THAT is a good thing. 😀

To put my in perspective the average family spends $160.22 per month on Electricity. They also, spend roughly $2,600 on gasoline per year, whereas I spend roughly $200.

The point being, I am not average. None of us are truly average... we are above or below in most things.


12-15-23, Advance Retail Sales Report for November Data

Advance Monthly Sales for Retail and Food Services, November Report.

First up should be the revisions...


Note the -0.2% downward revision in October's numbers and as always, remember this data is NOT inflation adjusted. Now onto the current report...
Advance estimates of U.S. retail and food services sales for November 2023, adjusted for seasonal variation and holiday and trading-day differences, but not for price changes, were $705.7 billion, up 0.3 percent (±0.5 percent)* from the previous month, and up 4.1 percent (±0.7 percent) above November 2022.

The inflation adjusted chart looks like this...


It is hard to capture from the graph, but "Real" sales are advancing very slowly since January, although still below 2022 average levels. Year over year, up +0.8% inflation adjusted, with the month being up +0.5% after inflation adjustements. 

So it can be called a win.


Wednesday, December 13, 2023

Producer Price Index December release November 2023 Data

The BLS has released the November Producer Price Index Report (historical releases)

The Producer Price Index for final demand was unchanged in November, seasonally adjusted, the U.S. Bureau of Labor Statistics reported today. Final demand prices decreased 0.4 percent in October and rose 0.4 percent in September. (See table A.) On an unadjusted basis, the index for final demand increased 0.9 percent for the 12 months ended in November.

In November, the indexes for both final demand goods and for final demand services were unchanged. 


Final demand goods: The index for final demand goods was unchanged in November after dropping 1.4 percent in October. In November, price increases of 0.6 percent for final demand foods and 0.2 percent for final demand goods less foods and energy offset a 1.2-percent decrease in the index for final demand energy.

Let's revisit that paragraph. What did the -1.2% decrease in the index for final demand energy... offset?

Within final demand goods in November, prices for chicken eggs jumped 58.8 percent. The indexes for fresh fruits and melons, utility natural gas, electric power, and carbon steel scrap also moved higher. In contrast, prices for gasoline fell 4.1 percent.

So gasoline (-4.1%), which is typically moving into seasonal lows, is the reason for that -1.2% decrease, which offsets a bunch of rises in food (+0.6%) and other energy components. 

Not to nitpick, but if gasoline is having that impact, and is moving into seasonal lows, which might continue through the December release... could reverse beginning after Christmas, just like last year.

For those of us that like to eat food, that annualized 7.2% increase in food is going to weigh on the budget of many of us, unless we decide to eat less and lose "weight".

Tuesday, December 12, 2023

BLS Data Dump. CPI - December 12, 2023

First up is the BLS Report for CPI...(historical releases)

The Consumer Price Index for All Urban Consumers (CPI-U) increased 0.1 percent in November on a seasonally adjusted basis, after being unchanged in October, the U.S. Bureau of Labor Statistics reported today. Over the last 12 months, the all items index increased 3.1 percent before seasonal adjustment.

I think the numbers were somewhat in line with everyone's expectations.

I do find the food portion of the darn thing a bit intriguing.


While the overall index has increased 17.4% since January, 2021, the food at home index has jumped 20.3%

Oddly, when adjusting the index to "average" household spending the food at home has jumped 29.6%, in current dollars.

What really catches the eye, is the -8.5% drop in current dollars for food away from home. This would be cafeterias, restaurants, and other places "away" from home.

This type of comparison with weightings against the index, further indicates a drop in current dollar spending for food in all categories... compared to rate of inflation.


The CPI index has an increase in prices of 20%, yet current dollar spending is 11.6%. The food away from home industry is not keeping up, as I suspect more meals are prepared at home... or people are cutting back on eating. [NOT]


Real average hourly earnings for all employees increased 0.2 percent from October to November, seasonally adjusted, the U.S. Bureau of Labor Statistics reported today. This result stems from an increase of 0.4 percent in average hourly earnings combined with an increase of 0.1 percent in the Consumer Price Index for All Urban Consumers (CPI-U).

Here is a graph...


Tis a nickel better than February, 2020. Merry Christmas!


Friday, December 1, 2023

My Analysis Methods Regarding CPI and Weightings.

I was prompted recently, by the uproar of the inflation data and CPI "hiding" information. I think the information is there, but a lot of folks don't bother to read past the headline.

An example would be the food component.

To understand my recent research, understand an article was written by a mainstream media source that stated... the typical American family must spend $11,400 more now on the basics, compared to January of 2021. They cited the BLS data.

So the January 2021 BLS report, had the print at 261.582. The October 2023 BLS report, rolled in at 307.671. Overall, it shows inflation rose 17.619%, during that period.

If that family is spending $11.4K more, then they were spending at an annual rate of $64,700, in January 2021, compared to a current rate of $76,100. A difference of $11.4K or 17.619%.

This is the basic CPI print for food total, food at home, and food away from home...

Now that those conditions are understood... onto the weightings.

This is what happens, when the weightings are thrown into the mix...


Note that food overall is much less at 11.4%, than the first chart's 20.2%. However, food at home jumps to 29.4% from the former chart's 20.9%. Oddly, the actual food away from home spending has fallen -10.7% since January 2021.

We are spending much more on food at home, than the BLS numbers indicate. It is due to fluctuations in weightings. These fluctuations are found in almost, if not all... categories.


Wednesday, November 22, 2023

Comparison of Inflation in selected countries- November, 2023 Edition

With the United Kingdom, Canada and EUstats release of October data, I have updated my comparison graph. [Note, the USA(EU method) is directly from Eurostat.]


My electricity bills over time (January 2017~ November 2023)

Once again, I monitor my residential electricity costs.


As always, weather is a factor in consumption, which is why a rolling average is also important. Currently, that 12 month rolling average is -2.4% below last year. 
[I suspect it might continue to be lower, as I altered the thermostat settings in December of 2022. I adjusted the nighttime heating settings from 68°F to 72°F, which would increase the usage in winter time. Daytime heat settings remained at 72°F.

Cooling settings remain at 76°F daytime and 72°F for nighttime. Additionally, the number of days between meter readings vary.]
Currently, the 2023 average is below last year. Also, it should be noted that year over year... or base effects come into play, which tends to hide the overall increases. 

So what might seem like good news, still carries quite a bite on the budget. The CPI-U suggests that the average consumer spends about 2.559% of their expenses on electricity... or about $150 per month. 

My average is significantly short of that dollar amount, percentage wise. However my electricity expenses, compared to overall expenses, is well north of 2.559%. Which means other items in the expenditure basket are constrained.

While it (electricity costs) might end up being below last year, the cost of that electricity  has surged 10.2% since February, 2021. I don't expect it to fall back to levels of that time. 


This month's bill, is the lowest in this range, but the billing month was for a mere 24 days. 466 KWH was usage, so 13.65¢ per KWH. Last month was 33 days, at 13.7¢ per KWH.

Tuesday, October 17, 2023

10-17-23, Advance Retail Sales Report for September Data

Advance Monthly Sales for Retail and Food Services, September 2023

Advance estimates of U.S. retail and food services sales for September 2023, adjusted for seasonal variation and holiday and trading-day differences, but not for price changes, were $704.9 billion, up 0.7 percent (±0.5 percent) from the previous month, and up 3.8 percent (±0.7 percent) above September 2022. Total sales for the July 2023 through September 2023 period were up 3.1 percent (±0.4 percent) from the same period a year ago. The July 2023 to August 2023 percent change was revised from up 0.6 percent (±0.5 percent) to up 0.8 percent (±0.1 percent).

Retail trade sales were up 0.7 percent (±0.5 percent) from August 2023, and up 3.0 percent (±0.5 percent) above last year. Nonstore retailers were up 8.4 percent (±1.6 percent) from last year, while food services and drinking places were up 9.2 percent (±2.3 percent) from September 2022.

As always, a reminder... "not for price changes", means not adjusted for inflation.


The term "resilient" continues to be overused, when clearly the actual "stuff" being bought is rather stagnant. 

That's not to say that last month's data was not an improvement, as both month to month and year over year were up... after adjusting for inflation. However, a rolling 12 month average indicates slippage of -0.1%, when adjusted for inflation.

That includes last September, which got revised downward... ever so slightly.


It should be noted, that today's report is +1.8% above January in current dollars, yet -1.1% when inflation adjusted. THAT is after all the revisions to January. Which begs the question... what will next month's backward revisions be.

You won't hear about it, as the mantra... "if it can't be spinned positively, ignore it." I am not saying the Census Bureau minions are at work here, but politicians and their friendly media darlings do.

I will continue to monitor thee monthly reports, however this is the last in this series.

Thursday, October 12, 2023

BLS Data Dump. CPI - October 12, 2023

First up is the BLS Report for CPI...(historical releases)

The Consumer Price Index for All Urban Consumers (CPI-U) rose 0.4 percent in September on a seasonally adjusted basis, after increasing 0.6 percent in August, the U.S. Bureau of Labor Statistics reported today. Over the last 12 months, the all items index increased 3.7 percent before seasonal adjustment.

The index for shelter was the largest contributor to the monthly all items increase, accounting for over half of the increase. An increase in the gasoline index was also a major contributor to the all items monthly rise. While the major energy component indexes were mixed in September, the energy index rose 1.5 percent over the month. The food index increased 0.2 percent in September, as it did in the previous two months. The index for food at home increased 0.1 percent over the month while the index for food away from home rose 0.4 percent. 

The index for all items less food and energy rose 0.3 percent in September, the same increase as in August. Indexes which increased in September include rent, owners' equivalent rent, lodging away from home, motor vehicle insurance, recreation, personal care, and new vehicles. The indexes for used cars and trucks and for apparel were among those that decreased over the month.

I had readings of 3.6%~3.9%, so the 3.7% was within that range.

The past 12 months...

My own CPI...
The C.O.L.A. was announced at 3.2%.

The results, compared to average S.S. income and various CPI methods. Once the average monthly S.S. is adjusted for Medicare Part B, the result is 2.9%.

Then compare the average 3 month of each CPI method, yields the headline CPI of 3.5%; Chained CPI at 3.6%; R-CPI-E at 4.1%; the end result of S.S. monthly minus projected Medicare part B... stands in sharp contrast to actual inflationary pressures.


'Nuff said!

This concludes my monthly publication of CPI.


BLS Data Dump. Real Earnings - October 12, 2023

The BLS has released the latest Real Earnings Report.

Real average hourly earnings for all employees decreased 0.2 percent from August to September, seasonally adjusted, the U.S. Bureau of Labor Statistics reported today. This result stems from an increase of 0.2 percent in average hourly earnings combined with an increase of 0.4 percent in the Consumer Price Index for All Urban Consumers (CPI-U).

Real average weekly earnings decreased 0.2 percent over the month due to the change in real average hourly earnings combined with no change in the average workweek.  

Real average hourly earnings increased 0.5 percent, seasonally adjusted, from September 2022 to September 2023. The change in real average hourly earnings combined with a decrease of 0.6 percent in the average workweek resulted in a 0.1-percent decrease in real average weekly earnings over this period.

I added emphasis to the decrease.

Graph time...


I suppose the good news... the Real Hourly is still +2¢ above pre covid, and down -2¢ from last month.

Real Weekly is +$2.08 above pre-covid, but down -71¢ from last month, AND... down -$1.10 from July.


The working stiffs are 14¢ above pre-covid on an hourly basis, yet down -1¢ from previous month, as well as down -7¢ from July.


The working stiffs are $5.43 above pre-covid on a weekly basis, yet down -59¢ from last month, and down -$2.45 from July.

The bad news, is all areas had a setback in inflation adjusted earnings in September. Let's hope that does not continue.

This closes out my publication of this data, although I will continue tracking. I'll just keep my thoughts to myself... unless I can't help myself.


Wednesday, October 11, 2023

Producer Price Index October release with September 2023 Data

The BLS has released the September Producer Price Index Report (historical releases) 

The Producer Price Index for final demand increased 0.5 percent in September, seasonally adjusted, the U.S. Bureau of Labor Statistics reported today. Final demand prices rose 0.7 percent in August and 0.6 percent in July. (See table A.) On an unadjusted basis, the index for final demand advanced 2.2 percent for the 12 months ended in September, the largest increase since moving up 2.3 percent for the 12 months ended in April. 

Leading the increase in the final demand index in September, prices for final demand goods rose 0.9 percent. The index for final demand services advanced 0.3 percent.

Prices for final demand less foods, energy, and trade services increased 0.2 percent in September, the fourth consecutive advance. For the 12 months ended in September, the index for final demand less foods, energy, and trade services moved up 2.8 percent.


As is often the case... there were revisions to previous month's data, so don't be surprised if this month's data is revised next month. The size of July's data was a bit surprising however. When that data came out, it was considered above expectations at +0.3%. A couple of month's later, it was revised to +0.6%, without any discussion.


In any case, I will continue to track, but this should wrap up publishing my thoughts.


Friday, September 29, 2023

Natural Gas Summary, UK, EU, USA... Week Ending 9-29-2023

The Energy Information Administration released their weekly report


At long last, all regions are above both last year and 5 year average. Hooray!
EIA.GOV via SNL Energy
Now for a look at The European Union and United Kingdom.

[The reason for this observation is LNG, which has introduced the prospect of U.S. Natural Gas prices being affected by global demand for LNG. The EU and UK serve as a benchmark for these demand issues.]

Time to wrap up the publishing of this weekly natural gas summary...


Review of August data and the September PCE Release

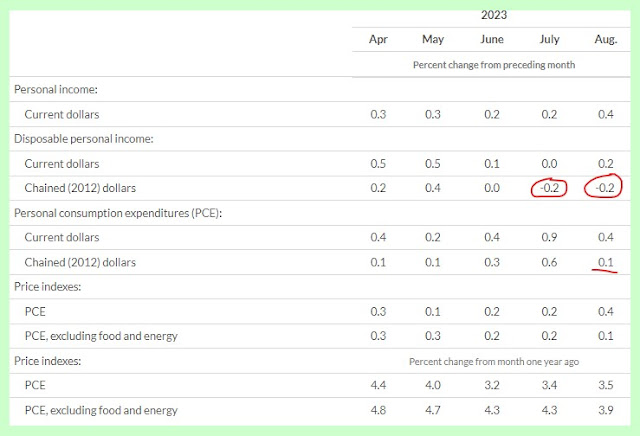
Yep, today's report was positive, with an uptick of +0.4%. That being in current dollars and when adjusted for inflation became... -0.2% for the month to month. The good news was the year to year inflation adjusted +0.1%. 

I did not denote the various changes from previous month's release, so but can be seen in previous publications.


It should be noted that multiple adjustments were made to previous readings, as indicated below...


The FED chain type report of PCE, excluding food and energy was adjusted to 2017 from previous 2012.


The 3.9% current, hearkens back to May of 2021, when things were transitory. The signs are pointing downward, but that 3.0% target remains distant, imho.

The scorecard for this month looks like this.

If I were grading this report, it would be 47.1%, compared to last month's 52.9%. Translation: My confidence in inflation heading towards 2.0% is not as great as some are predicting. 

Monday, September 25, 2023

My electricity bills over time (January 2017~ September 2023)

Once again, I monitor my residential electricity costs.


As always, weather is a factor in consumption, which is why a rolling average is also important. Currently, that 12 month rolling average is +0.6% above last year. Which might indicate the cost running slightly below last year, when factoring in the following.
[I suspect it might be lower, as I altered the thermostat settings in December of 2022. I adjusted the nighttime heating settings from 68°F to 72°F, which would increase the usage in winter time. Daytime heat settings remained at 72°F.

Cooling settings remain at 76°F daytime and 72°F for nighttime. Additionally, the number of days between meter readings vary.]


Currently, the 2023 average is above last year, but that is with 3 more months of bills to follow, which are generally... sightly lower than current average. Also, it should be noted that year over year... or base effects come into play, which tends to hide the overall increases. 

So what might seem like good news, still carries quite a bite on the budget. The CPI-U suggests that the average consumer spends about 2.559% of their expenses on electricity... or about $150 per month. 

My average is significantly short of that dollar amount, percentage wise. However my electricity expenses, compared to overall expenses, is well north of 2.559%. Which means other items in the expenditure basket are constrained.

While it (electricity costs) might end up being below last year, the cost of that electricity  has surged 11.6% since February, 2021. I don't expect it to fall back to levels of that time.

Friday, September 22, 2023

Natural Gas Summary, UK, EU, USA... Week Ending 9-22-2023

The Energy Information Administration released their weekly report.


The Pacific Region has pushed above year ago levels and is very near the 5 year average.


Now for a look at The European Union and United Kingdom.

[The reason for this observation is LNG, which has introduced the prospect of U.S. Natural Gas prices being affected by global demand for LNG. The EU and UK serve as a benchmark for these demand issues.]

Data from the Aggregated Gas Storage Inventory report...


The United Kingdom continues to slide in percent of storage filled. It should be noted that UK does have access to natural gas supplies and infrastructure for LNG. However, the flip side is more abrupt changes in pricing.


Which is most noticeable in the forward futures, as shown on this chart.


The US market continues to be somewhat stable. 

Thursday, September 21, 2023

Comparison of Inflation in selected countries- September, 2023 Edition

With the United Kingdom, Canada and EUstats release of August data, I have updated my comparison graph. [Note, the USA(EU method) is directly from Eurostat.]


The USA (CPI: +3.7%; +2.5% Eurostate method) and Canada +4.0%, ticked up for the 2nd consecutive month, with regards to year over year inflation. 

The EU has marked 10 consecutive months of decline in year over year inflation at 5.9%. That figure was down from 6.1% last month. It was not even across the board, as Germany's 6.5% of last month, dipped to 6.4%, which was improvement, but some countries... such as France increased from 5.1% to 5.7%, according to Eurostat.

The UK has now marked its 3rd consecutive decline at 6.3%, with the month over month at +0.4%, which was up from previous 2 months.

This Week in Petroleum Summary May 8th, 2024 per EIA.GOV

This week's  full report . Gasoline fell -2.3¢ for the week, but remains +10.3¢ from year ago level. Consumption did edge up this past r...