Tuesday, June 13, 2023

CPI Latest DATA results, June 13, 2023

The BLS report was released this morning and it was a shade below consensus estimates. (historical releases)

The Consumer Price Index for All Urban Consumers (CPI-U) rose 0.1 percent in May on a seasonally adjusted basis, after increasing 0.4 percent in April, the U.S. Bureau of Labor Statistics reported today. Over the last 12 months, the all items index increased 4.0 percent before seasonal adjustment.

The index for shelter was the largest contributor to the monthly all items increase, followed by an increase in the index for used cars and trucks. The food index increased 0.2 percent in May after being unchanged in the previous 2 months. The index for food at home rose 0.1 percent over the month while the index for food away from home rose 0.5 percent. The energy index, in contrast, declined 3.6 percent in May as the major energy component indexes fell.

I read some reports how inflation came in well below expectations. Apparently those expectations got inflated prior to this release. The expected inflation Y/Y was 4.13% and this report came in at 4.048%.

It goes without saying that energy costs going down is a major factor in these lower inflation rates.

Yes, today's release is the lowest since March, 2021. However, the period since that date has seen overall prices increase 14.82% in that 26 month period. Which matches the rise of prices from August, 2012 until March, 2021. A period of 103 months.

Here is some food for thought. Food at home, has risen 19.5% in the 26 months, since March, 2021. It rose 19.5% from May, 2008, until March, 2021... a period of 102 months.

Those stats are a bit hard to chew.

So yes, inflation is slowing and should continue to slow. But once again, without the energy component, and the food component... prices increased 5.3%. Food was generally flat for the month, but still up 5.8% Y/Y.

My own personal CPI...
The current report card...

It is down across the board and hopefully... will continue to slide. 


Friday, June 9, 2023

Natural Gas Inventory Report, June 09, 2023

The Energy Information Administration released their weekly report on yesterday.


And now a look at regional, specifically Pacific.


Prices in West Coast markets remain the highest of all major pricing hubs this report week. The price at PG&E Citygate in Northern California rose 65 cents, up from $3.07/MMBtu last Wednesday to $3.72/MMBtu yesterday. The price at SoCal Citygate in Southern California increased $1.11 from $2.18/MMBtu last Wednesday to $3.29/MMBtu yesterday. The price at Sumas on the Canada-Washington border rose 47 cents from $1.70/MMBtu last Wednesday to $2.17/MMBtu yesterday. Natural gas consumption in the Western region increased by 13%, or 0.9 billion cubic feet per day (Bcf/d), which was led by a 38% (1.0 Bcf/d) increase in consumption in the electric power sector, according to data from S&P Global Commodity Insights.

Select inventories of EU and UK...


Prices rose sharply on the EU and UK markets this past week. Nearby by months by 8% with max 12 month at 2.5%.

I have no real explanation, as I never bothered to research reasons. Although it is not so unusual for summer months, for there to be a spike. Afterall... hot weather is here.

Wednesday, June 7, 2023

Gasoline consumption per latest EIA data, June 08, 2023

Gasoline prices (per AAA) remained relatively flat, from last report at $3.553, or down -2.1¢. One year ago the price had ballooned to $4.919. 

Consumption increased +0.3% from last week, and stands 1.6% above year ago numbers. (This is a four week moving average).

The import/export surplus of gasoline since last March 1st 2022, stands at +99.8M barrels. The import/export numbers have really not changed that much over the past few weeks and this past week showed more exports than imports, by a mere +15K daily. 

Where will pump prices be next week? My estimate last week was -4.7¢ and ended up with a down -2.1¢. The right direction at least. 

Not sure that will happen this coming week, as several factors have me leaning to pump prices heading a bit higher. Again, the range may be in the ±5¢, with a slight upward bias. 


Crude and Petroleum Product Inventories - June 07 2023

Data per the EIA weekly report.

Crude stocks fell- 452K barrels, from last week, and remains down -3.3% from the 5 year seasonal average. It should be noted the 5 year average includes the abnormal 2020 and 2021 number. Otherwise, the current inventory is nearly +1.2% above normal.

Distillates inventory surged +5.1M barresl; and Gasoline inventories climbed +2.7M barrels barrels. The SPR fell another -1.867M barrels.

WTI is $72.56, compared to $70.02, one week ago, and $114.54, one year ago. (It began the big slide from there).

Refinery output continues to edge up on a weekly basis, as well as above year ago levels.

For anyone interested, the U.S. has exported 688.7M barrels of crude and petroleum products, more than imported, since March 1, 2022. There was only a slight bump this week. 

Overall, crude stocks remain quite healthy, despite the major drop and compared to this time last year, with days supply at 28.3, compared to last year's 25.3 days.


Saturday, June 3, 2023

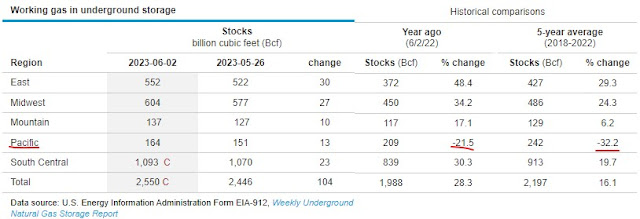
Natural Gas Inventory Report, June 02, 2023

The Energy Information Administration released their weekly report on Friday.


The national inventory stock remains above 5 year average and is keeping pace with seasonal movements. As usual, the Pacific region is lagging, but showing significant gains each week.


Select regional spot prices: Natural gas spot prices fell at most locations this report week (Wednesday, May 24, to Wednesday, May 31), except for prices in the Northeast. Price changes at major pricing hubs this report week ranged from a decrease of 29 cents/MMBtu at the Waha Hub in western Texas to an increase of $3.30/MMBtu at the Algonquin Citygate in the Northeast.

Select inventories of EU and UK...

Prices continue to fall on the UK and EU markets. The UK spread of 12 month futures is annually at £1,441.34 ~ £2,174.50, with OFGEM setting the cap at £2,074. That cap is consistent with NatGas prices of £94.51 per Therm or $11.76 per MMbtu. November futures rise above the cap.


The lowering of the (annual) energy cap from £2,500 to £2,074 is certainly a great relief, however it was only 2 years ago, it was something like £1,200 annually for the average household. The monthly energy charges have fallen substantially and is reflected in the U.K. CPI
  • gas provided a downward contribution of 0.75 percentage points to the monthly change in CPIH
  • electricity provided a downward contribution of 0.67 percentage points to the monthly change in CPIH.
 
Energy costs have abated, but elsewhere is very troubling, in my humble opinion.  

Thursday, June 1, 2023

Gasoline consumption per latest EIA data, June 01, 2023

Gasoline prices (per AAA) remained flat from last report at $3.574 One year ago the price had ballooned to $4.671

Consumption increased +1.3% from last week, and stands 3.3% above year ago numbers. (This is a four week moving average).


The import/export surplus of gasoline since last March 1st 2022, stands at +99.7M barrels. The import/export numbers have really not changed that much over the past few weeks and this past week showed more exports than imports, by +118K daily. 

Where will pump prices be next week? The crack spread is easing and the range appears biased to the downside. My estimate last week was +6.6¢ and was flat, so this week, I am guessing a downside of about -4.7¢. Here's hoping I continue to overestimate the pump price.


Crude and Petroleum Product Inventories - June 01 2023

Data per the EIA weekly report.

Crude stocks rose +4.9M barrels, from last week, and remains down -3.0% from the 5 year seasonal average. It should be noted the 5 year average includes the abnormal 2020 and 2021 number. Otherwise, the current inventory is nearly +1.6% above normal.

Distillates increased +985K; and Gasoline inventories slid -207K barrels. The SPR fell another -2.5M barrels.


WTI is $70.02, compared to $74.19, one week ago, and $112.72, one year ago. 

Refinery output continues to edge up on a weekly basis, as well as above year ago levels.

For anyone interested, the U.S. has exported 687.9M barrels of crude and petroleum products, more than imported, since March 1, 2022. 

Overall, crude stocks remain quite healthy, despite the major drop and compared to this time last year, with days supply at 28.7, compared to last year's 25.9 days.


1-17-2025 Week In Review

Laugh of the week Watching Sky News and a lady proclaimed that social media sites should be held to the same strict standards as newspaper p...