This week's full report.
Wednesday, March 27, 2024
This Week in Petroleum Summary March 27th, 2024 per EIA.GOV
Wednesday, March 20, 2024
This Week in Petroleum Summary March 20th, 2024 per EIA.GOV
This week's full report.
Comparison of Inflation in selected countries- March, 2024 Edition
With the United Kingdom, Canada and EUstats release of February data, I have updated my comparison graph. [Note, the USA(EU method) is directly from Eurostat.]
Tuesday, March 19, 2024
A Foray into the 2024 Presidential Election, Part XII
It's been a couple of weeks, since the last review. Not a lot has changed, but there were some minor adjustments.
The republican edge in Arizona, narrowed a bit (-0.2%), but still in the slight range beyond the margin of error.
The republican edge in Pennsylvania, increased a bit (+0.8), which moved it from the Toss Up category back to slight, with it being just above the margin of error.
Saturday, March 16, 2024
My electricity bills over time (March, 2024 Edition)
Just for fun, I track my electricity usage and voila!!
Thursday, March 14, 2024
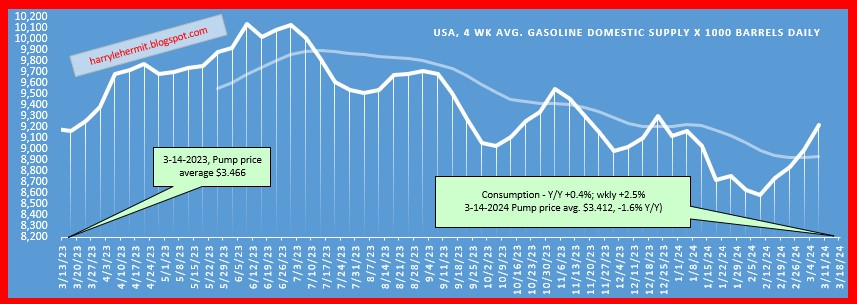
This Week in Petroleum Summary March 14th, 2024 per EIA.GOV
This week's full report.
Consumption is heading up, just ahead of this week, last year.
PPI Mar. 2024 release February 2024 Data
The BLS has released the February, 2024 Producer Price Index Report. (historical releases)
The Producer Price Index for final demand rose 0.6 percent in February, seasonally adjusted, the U.S. Bureau of Labor Statistics reported today. Final demand prices increased 0.3 percent in January and edged down 0.1 percent in December 2023. (See table A.) On an unadjusted basis, the final demand index advanced 1.6 percent for the 12 months ended in February, the largest rise since moving up 1.8 percent for the 12 months ended September 2023.
In February, nearly two-thirds of the rise in final demand prices can be traced to the index for final demand goods, which advanced 1.2 percent. Prices for final demand services moved up 0.3 percent.
The index for final demand less foods, energy, and trade services increased 0.4 percent in February after rising 0.6 percent in January. For the 12 months ended in February, prices for final demand less foods, energy, and trade services moved up 2.8 percent.
Current graph with revisions...
Then there is this chart, which briefly compares the category to previous month's annual rate.
The latest petroleum inventories (Sep-02-2026)
A mixed bag, with crude falling, as well as gasoline, jet fuel and SPR. Distillate edged up, as well as Jet fuel. Gasoline consumption is e...
-
Today's EIA.gov report . Crude stocks up again, +7.6M barrels, from last week; Distillates up +2.7M Barrels; and Gasoline slid -1.9M b...
-
The PCE numbers for January finally arrived yesterday, so the January numbers... Nothing to extreme. I recognize much of February reportage ...
-
A few reports of interest (to me), from this past week. Trade Report Petroleum Report The international trade numbers are self explanatory i...