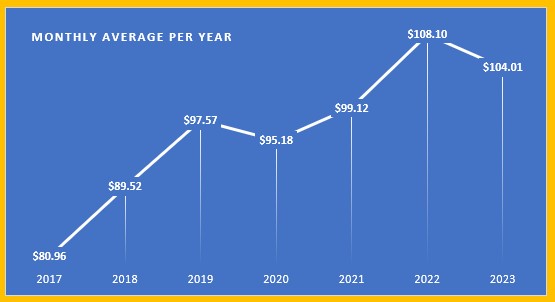
I do odd things, one of which is monitoring my electric bills.
Obviously, my electricity usage is based on weather, which does change from time to time. While the graph is based on actual payments based on month bill is due, I utilize a rolling 12 month average, to gauge year to year changes.
Currently that 12 month rolling average is +3.1% above year ago levels. I suspect it might be lower, as I altered the thermostat settings in December of 2022. I adjusted the nighttime heating settings from 68°F to 72°F, which would increase the usage in winter time. Daytime heat settings remained at 72°F.
Cooling settings remain at 76°F daytime and 72°F for nighttime.
Currently, the 2023 average is below last year, but that is with 4 more months of bills, which are generally higher than current average. Also, it should be noted that year over year... or base effects come into play, which tends to hide the overall increases.
So what might seem like good news, still carries quite a bite on the budget. The CPI-U suggests that the average consumer spends about 2.754% of their expenses on electricity... or about $150 per month.
While my average is significantly short of that dollar amount, percentage wise... my electricity expenses are well north of 2.754%.


No comments:
Post a Comment