Wednesday, May 17, 2023

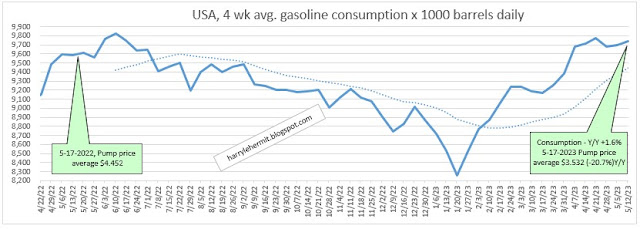
Gasoline consumption per latest EIA data, May 17, 2023

Gasoline prices were (per AAA) were flat this week, from $3.531 to $3.532. So okay... one tenth of  once cent more. A year ago, the price had ballooned to $4.452. 

Consumption increased +0.4% from last week, and stands 1.6% above year ago numbers. (This is a four week moving average).

The import/export surplus of gasoline since last March 1st 2022, stands at +99.2M barrels. The import/export numbers have really not changed that much over the past few weeks and this past week showed more exports than imports, by 600K. 

Where will pump prices be next week? There does not appear much change in pump prices, as the range might be in the ± 5¢ range.

Crude and Petroleum Product Inventories - May 17 2023

Today's EIA.gov report

Crude stocks jumped +5.0M barrels, from last week, and remains down -1.7% from the 5 year seasonal average. It should be noted the 5 year average includes the abnormal 2020 and 2021 number. Otherwise, the current inventory is nearly +2.8% above normal.

Distillates held steady; and Gasoline inventories slid -1.3M barrels. The SPR fell another -2.4M barrels. 

WTI is steady at $72.74, compared to $72.92, one week ago, and $106.76, one year ago. 

Refinery output continues to edge up on a weekly basis, as well as above year ago levels.

For anyone interested, the U.S. has exported 659.1M barrels of crude and petroleum products, more than imported, since March 1, 2022.

Overall, crude stocks remain quite healthy, compared to this time last year, with days supply at 29.5, compared to last year's 26.8 days.

Distillates remain steady to last year.


Tuesday, May 16, 2023

5-16-23, Advance Retail Sales Report for April

Advance Monthly Sales for Retail and Food Services, April 2023.

Advance estimates of U.S. retail and food services sales for April 2023, adjusted for seasonal variation and holiday and trading-day differences, but not for price changes, were $686.1 billion, up 0.4 percent (±0.5 percent)* from the previous month, and up 1.6 percent (±0.7 percent) above April 2022. Total sales for the February 2023 through April 2023 period were up 3.1 percent (±0.4 percent) from the same period a year ago. The February 2023 to March 2023 percent change was revised from down 0.6 percent (±0.5 percent) to down 0.7 percent (±0.2 percent).

Retail trade sales were up 0.4 percent (±0.5 percent)* from March 2023, and up 0.5 percent (±0.5 percent)* above last year. Nonstore retailers were up 8.0 percent (±1.2 percent) from last year, while food services and drinking places were up 9.4 percent (±2.5 percent) from April 2022.

As always, these figures are not adjusted for inflation, so +1.6% above year ago levels, when inflation adjusted comes down to something like -3.2%.

Now for those revisions. Yes, April was up 0.4% from previous month, which was revised from -0.6% to -0.7%. Doesn't seem bad, until you look at the previous month's revisions.

The revisions for January, February, March were sizable. So after those sizable revisions... you do end up with -0.7% for the previous month. 

We seem to be on a trend of downward revisions, and then extolling the current report. I suspect this month will be revised downward for next month... so next month can seem like a positive. 

So, I do not have a positive spin on this report.

As has been the case for several months, the "quantity" has remained stagnant, while spending increases. 

Adjusting for inflation, the actual volume of sales has remained rather flat for the past two years. 

There were winners and losers, but the revisions really distorted previous lists of winners and losers... such that I cannot attempt a realistic review. (Mostly laziness)!

Friday, May 12, 2023

Natural Gas Inventory Report, May 12, 2023

The Energy Information Administration released their weekly report on Thursday.

As usual the above graph does not capture the whole story by region. The west coast is still lagging, but beginning to gain ground. That should continue as west coast nat/gas pricing has fallen below the Henry Hub, which is now one of the highest in the U.S., which is at lows not seen since 2020.


European and United Kingdom storage continues to gain and remain at seasonally elevated levels.

The pricing for UK and TTF nat/gas, continues above "normal".


So far... so good!!


Thursday, May 11, 2023

Producer Price Index May 2023 release for April Data.

The BLS has released the April Producer Price Index Report (historical releases)

The Producer Price Index for final demand advanced 0.2 percent in April, seasonally adjusted, the U.S. Bureau of Labor Statistics reported today. Final demand prices fell 0.4 percent in March and were unchanged in February. On an unadjusted basis, the index for final demand moved up 2.3 percent for the 12 months ended in April. 

In April, 80 percent of the rise in the index for final demand is attributable to a 0.3-percent increase in prices for final demand services. The index for final demand goods advanced 0.2 percent.

Prices for final demand less foods, energy, and trade services rose 0.2 percent in April after inching up 0.1 percent in March. For the 12 months ended in April, the index for final demand less foods, energy, and trade services increased 3.4 percent.

Certainly, the PPI increases have slowed, but not sure all has been reflected in the CPI. Historically, the CPI is has risen slightly faster that PPI, yet the past 3 years has seen the PPI outdistance the CPI. This is reflected in the following graph.

The chart indicates the comparison of that 39 month period, compared to the preceding 109 months.

Reverting to normal requires a negative PPI and/or continued inflation for the next few months. 

It will take most of the year, before normal takes places, imho. 

Wednesday, May 10, 2023

Gasoline consumption per latest EIA data, May 10, 2023

Gasoline prices were (per AAA) were down -5.5¢ this week, to $3.531. A year ago, the price had ballooned to $4.374. I eventually projected a -10.2¢ decrease, and missed the mark. Those falling prices might be over, although not a sharp rise seems in the offing. Maybe +2.6¢ for the coming week.

Consumption increased +0.2% from last week, and stands 1.1% above year ago numbers. (This is a four week moving average).

The import/export surplus of gasoline since last March 1st 2022, stands at +98.6M barrels. The import/export numbers have really not changed that much over the past few weeks and this past week showed more imports than exports, by 700K. 

Where will pump prices be next week? As stated earlier, maybe another +2.6¢ upward, or around $3.55.

That is a darn sight better than last year, which was about $4.50 a gallon 1 year ago, next week. 


Crude and Petroleum Product Inventories - May 10 2023

Today's EIA.gov report

Crude stocks jumped +2.9M barrels, from last week, and remains down -2.6% from the 5 year seasonal average. It should be noted the 5 year average includes the abnormal 2020 and 2021 number. Otherwise, the current inventory is nearly +2.2% above normal.

Distillates fell -4.2M Barrels; and Gasoline inventories slid -3.1M barrels. The SPR fell another -2.9M barrels. 


WTI has risen to $72.92, compared to $68.41, one week ago, and $96.87, one year ago. 

Refinery output edged up on a weekly basis, and edged above year ago levels.

For anyone interested, the U.S. has exported 645.6M barrels of crude and petroleum products, more than imported, since March 1, 2022.

Overall, crude stocks remain quite healthy, compared to this time last year, with days supply at 29.3, compared to last year's 27.1 days.

Distillates remain steady to last year, despite this week's inventory drop.

1-17-2025 Week In Review

Laugh of the week Watching Sky News and a lady proclaimed that social media sites should be held to the same strict standards as newspaper p...