Wednesday, August 23, 2023

Crude and Petroleum Product Inventories - August 23 2023

Data per the EIA weekly report

Crude stocks slid another -6.1M barrels, from last week, and is -2.5% below the 5 year seasonal average. It should be noted the 5 year average includes the abnormal 2020 and 2021 number. Otherwise, the current inventory is nearly +1.4% above normal.

Distillates inventory rose +945K barrels; and Gasoline inventories rose about +1.4M barrels. Distillates (-14.5%,-3.9%) and Gasoline (-3.7%, -1.9%) are both below 5 year and 3 year adjusted average inventories.

The SPR increased 600K barrels this past week. This is the 3rd straight week for increases, which are the first since January, 2021.

WTI is $78.96, compared to $79.26 (-0.4%), one week ago, and $94.40, one year ago (-16.4%).
Refinery output edged upward on a weekly basis, and is slightly above above year ago levels

For anyone interested, the U.S. has exported 818.1M barrels of crude and petroleum products, more than imported, since March 1, 2022. It jumped +10.5M barrels this past week. (Distillates account for approximately 73%.

Overall, crude stocks remain somewhat healthy, compared to this time last year, with days supply at 26.0, to last year's 25.9 days.

Oddly in mid March, certain factors were quoted as the reason for runup in Crude prices, into Mid April. In early July, the same factors were quoted and as a reason for runup in Crude prices... until 2 weeks ago.

It may well be, that some of those factors will come into play. Be wary of the track record, imho.

Sunday, August 20, 2023

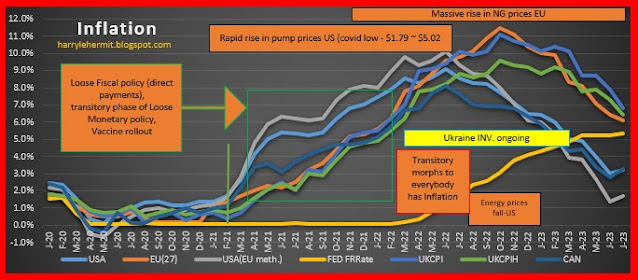
Comparison of Inflation in selected countries- August, 2023 Edition

With the United Kingdom, Canada and EUstats release of July data, I have updated my comparison graph...


Note, the USA(EU method) is directly from Eurostats. Once upon a time, the UK was also included. I guess somebody's nose got out of joint for some reason. 😈

In any case, there is some moderation with inflation in Europe and the UK, with the U.S. and Canada having a slight uptick... largely due to core inflation, but set to accelerate with energy prices now rising. Including in Europe and the UK.

Here is hoping for a mild winter, with no strikes and stable pricing going forward. 

Is that too much to ask for?

Friday, August 18, 2023

EU & UK NatGas Inventory Report, August 18, 2023

 Data from the Aggregated Gas Storage Inventory report...


Much is being made of the 90% achievement, 3 months early. Typically this would represent about 3 months of supply, if all sources were cut off. That will not happen, but winter expectations and potential Australian LNG strike has provided apprehension in the markets. That potential for less supply has sent the bidding upward.


Overall, the price of TTF NatGas is still below levels of 2 years ago -(13.2%). That was before the pipeline chicanery, blackmail, etc. 


U.S. NatGas Inventory Report, August 18, 2023

The Energy Information Administration released their weekly report yesterday.


The Pacific Region continues to be below year ago and 5 year averages, although significant gains from last week.
Price changes in California were mixed this week. The price at PG&E Citygate in Northern California fell 7 cents, down from $5.71/MMBtu last Wednesday to $5.64/MMBtu yesterday. The price at SoCal Citygate in Southern California increased $2.85 from $4.95/MMBtu last Wednesday to $7.80/MMBtu yesterday. El Paso Natural Gas Company reported maintenance on the North Mainline near Leupp, Arizona, beginning on Monday August 14. In addition, ongoing maintenance is occurring at the SoCalGas pipeline system. Prices in the West remain the highest in the country as above-average temperatures keep demand for cooling high and as the Pacific region remains the only region in the United States with below-average storage levels.

 
Henry Hub prices fell from last week, as well as on the futures market.


Wednesday, August 16, 2023

Gasoline consumption per latest EIA data, August 16, 2023

Gasoline prices (per AAA) rose from last report's $3.825, to $3.873. One year ago the price had fallen to $3.949, and was on its downward trajectory... into the early September lull, about $3.80. It rose a bit, then fell back to the December low.

Consumption slipped -0.3% week over week, and is +0.6% above year ago numbers. (This is a four week moving average). 


Having completely missed the pump price direction the past couple of weeks... I'll avoid any predictions for the this. Although my tried and true method has suddenly gone awry.

One thing is almost certain... The August CPI report will bring added political scrutiny to the price of gasoline. So pick your favorite bogeyman... the Ukraine War, Putin, price gouging by the oil industry, refineries, and the list goes on.

Crude and Petroleum Product Inventories - August 16 2023

Data per the EIA weekly report

Crude stocks slid -6.0M barrels, from last week, and is -2.3% below the 5 year seasonal average. It should be noted the 5 year average includes the abnormal 2020 and 2021 number. Otherwise, the current inventory is nearly +1.3% above normal.

Distillates inventory rose +296K barrels; and Gasoline inventories fell about -262K barrels. Distillates (-15.1%,-5.2%) and Gasoline (-5.0%, -2.6%) are both below 5 year and 3 year adjusted average inventories.

The SPR increased 600K barrels this past week. This follows last week's increase, which was the first real increase since early January, 2021.

WTI is $79.26, compared to $83.77 (-5.4%), one week ago, and $89.67, one year ago(-11.6%).

Refinery output edged upward on a weekly basis, and is slightly above above year ago levels

For anyone interested, the U.S. has exported 807.6M barrels of crude and petroleum products, more than imported, since March 1, 2022. It jumped +12.3M barrels this past week.

Overall, crude stocks remain somewhat healthy, compared to this time last year, with days supply at 26.5, to last year's 26.2 days.

Despite previous weeks concern about production cuts, it seems that China's lack of anticipated rebound... is becoming the dominant issue.

At least in the current news cycle.

Tuesday, August 15, 2023

8-15-23, Advance Retail Sales Report for July

Advance Monthly Sales for Retail and Food Services, July 2023

Advance estimates of U.S. retail and food services sales for July 2023, adjusted for seasonal variation and holiday and trading-day differences, but not for price changes, were $696.4 billion, up 0.7 percent (±0.5 percent) from the previous month, and up 3.2 percent (±0.7 percent) above July 2022. Total sales for the May 2023 through July 2023 period were up 2.3 percent (±0.4 percent) from the same period a year ago. The May 2023 to June 2023 percent change was revised from up 0.2 percent (±0.5 percent)* to up 0.3 percent (±0.2 percent).

Retail trade sales were up 0.6 percent (±0.5 percent) from June 2023, and up 2.0 percent (±0.5 percent) above last year. Nonstore retailers were up 10.3 percent (±1.6 percent) from last year, while food services and drinking places were up 11.9 percent (±2.3 percent) from July 2022.

The "but not for price changes, means not adjusted for inflation... 


While improved over last month by 0.5% when adjusted for inflation... year to year is flat.


In a previous column, I made mention of the Census Bureau's propensity to revise downward previous month's data to improve current month results. We are in the second month of previous month's data being revised upward... which is good news. May that become a trend going forward.

Non store retailers, continues to lead the pack, with Furniture and Electronics turning negative from last month. Clothing edged up from last month, with Food Services and drinking places accelerating.

What really stands out is the EX gasoline category, which rose 5.8% year over year, which is better than the CPI EX gasoline of 4.3%.

Room for optimism!


1-17-2025 Week In Review

Laugh of the week Watching Sky News and a lady proclaimed that social media sites should be held to the same strict standards as newspaper p...