Sunday, August 27, 2023

A look at my electricity bills over time

I do odd things, one of which is monitoring my electric bills. 

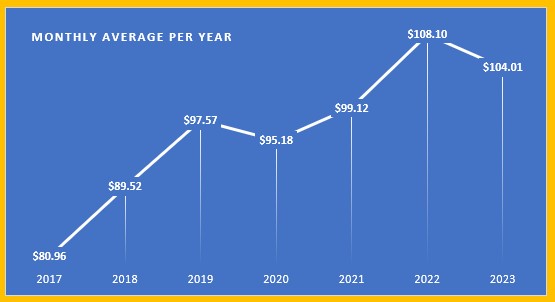
Obviously, my electricity usage is based on weather, which does change from time to time. While the graph is based on actual payments based on month bill is due, I utilize a rolling 12 month average, to gauge year to year changes.

Currently that 12 month rolling average is +3.1% above year ago levels. I suspect it might be lower, as I altered the thermostat settings in December of 2022. I adjusted the nighttime heating settings from 68°F to 72°F, which would increase the usage in winter time. Daytime heat settings remained at 72°F.

Cooling settings remain at 76°F daytime and 72°F for nighttime.


Currently, the 2023 average is below last year, but that is with 4 more months of bills, which are generally higher than current average. Also, it should be noted that year over year... or base effects come into play, which tends to hide the overall increases. 

So what might seem like good news, still carries quite a bite on the budget. The CPI-U suggests that the average consumer spends about 2.754% of their expenses on electricity... or about $150 per month. 

While my average is significantly short of that dollar amount, percentage wise... my electricity expenses are well north of 2.754%.

Friday, August 25, 2023

EU & UK NatGas Inventory Report, August 25, 2023

Data from the Aggregated Gas Storage Inventory report...


The storage continues to increase, and has surpassed same period of 2020.


Natural Gas prices moderated in both nearby and futures pricing, as the potential for a strike by Australian Unions at one LNG facility seemed to have abated. At least until another strike was threatened, which sent prices upward again... today.


While current prices in the EU and UK are below pricing of 2 years ago, they are still elevated compared to 2019 and 2020. Despite LNG exports, U.S. prices remain at 2019 and 2020 levels.

Thursday, August 24, 2023

U.S. NatGas Inventory Report, August 24, 2023

The Energy Information Administration released their weekly report today.


The Pacific Region continued to gain inventory, although still below one year ago and 5 year average.

The South Central region shed inventory over the week, yet remains well above year ago and 5 year average.
EIA.GOV, via SNL Energy
Generally speaking, natural gas prices are significantly below one year ago levels, and more in line with pre-covid levels. 

Current price levels suggest consumer inflation in natgas as well as pass through products (electricity) will continue to moderate. These products represent about 3.6% of the average consumer basket.


Wednesday, August 23, 2023

Gasoline consumption per latest EIA data, August 23, 2023

Gasoline prices (per AAA) slipped from last report's $3.873, to $3.845. One year ago the price had fallen to $3.892, and was on its downward trajectory... into the early September lull, about $3.80. It rose a bit, then fell back to the December low.

Consumption increase +1.4% week over week, and is +2.9% above year ago numbers. (This is a four week moving average). 

The good news, is the price seems to be easing a bit. Hopefully, it becomes a trend.

If history tells us anything... the increased consumption should begin to wane in the next couple of weeks. Then, if nothing else snaps... a descent in pump prices might be achieved. 👍

Crude and Petroleum Product Inventories - August 23 2023

Data per the EIA weekly report

Crude stocks slid another -6.1M barrels, from last week, and is -2.5% below the 5 year seasonal average. It should be noted the 5 year average includes the abnormal 2020 and 2021 number. Otherwise, the current inventory is nearly +1.4% above normal.

Distillates inventory rose +945K barrels; and Gasoline inventories rose about +1.4M barrels. Distillates (-14.5%,-3.9%) and Gasoline (-3.7%, -1.9%) are both below 5 year and 3 year adjusted average inventories.

The SPR increased 600K barrels this past week. This is the 3rd straight week for increases, which are the first since January, 2021.

WTI is $78.96, compared to $79.26 (-0.4%), one week ago, and $94.40, one year ago (-16.4%).
Refinery output edged upward on a weekly basis, and is slightly above above year ago levels

For anyone interested, the U.S. has exported 818.1M barrels of crude and petroleum products, more than imported, since March 1, 2022. It jumped +10.5M barrels this past week. (Distillates account for approximately 73%.

Overall, crude stocks remain somewhat healthy, compared to this time last year, with days supply at 26.0, to last year's 25.9 days.

Oddly in mid March, certain factors were quoted as the reason for runup in Crude prices, into Mid April. In early July, the same factors were quoted and as a reason for runup in Crude prices... until 2 weeks ago.

It may well be, that some of those factors will come into play. Be wary of the track record, imho.

Sunday, August 20, 2023

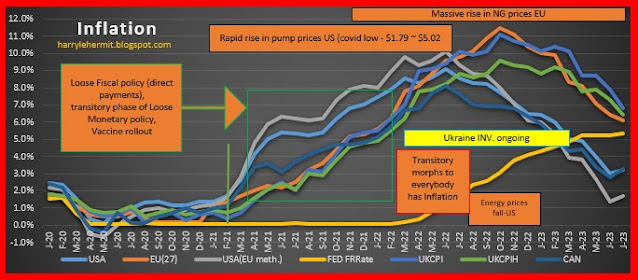
Comparison of Inflation in selected countries- August, 2023 Edition

With the United Kingdom, Canada and EUstats release of July data, I have updated my comparison graph...


Note, the USA(EU method) is directly from Eurostats. Once upon a time, the UK was also included. I guess somebody's nose got out of joint for some reason. 😈

In any case, there is some moderation with inflation in Europe and the UK, with the U.S. and Canada having a slight uptick... largely due to core inflation, but set to accelerate with energy prices now rising. Including in Europe and the UK.

Here is hoping for a mild winter, with no strikes and stable pricing going forward. 

Is that too much to ask for?

Friday, August 18, 2023

EU & UK NatGas Inventory Report, August 18, 2023

 Data from the Aggregated Gas Storage Inventory report...


Much is being made of the 90% achievement, 3 months early. Typically this would represent about 3 months of supply, if all sources were cut off. That will not happen, but winter expectations and potential Australian LNG strike has provided apprehension in the markets. That potential for less supply has sent the bidding upward.


Overall, the price of TTF NatGas is still below levels of 2 years ago -(13.2%). That was before the pipeline chicanery, blackmail, etc. 


1-17-2025 Week In Review

Laugh of the week Watching Sky News and a lady proclaimed that social media sites should be held to the same strict standards as newspaper p...