Tuesday, October 17, 2023

10-17-23, Advance Retail Sales Report for September Data

Advance Monthly Sales for Retail and Food Services, September 2023

Advance estimates of U.S. retail and food services sales for September 2023, adjusted for seasonal variation and holiday and trading-day differences, but not for price changes, were $704.9 billion, up 0.7 percent (±0.5 percent) from the previous month, and up 3.8 percent (±0.7 percent) above September 2022. Total sales for the July 2023 through September 2023 period were up 3.1 percent (±0.4 percent) from the same period a year ago. The July 2023 to August 2023 percent change was revised from up 0.6 percent (±0.5 percent) to up 0.8 percent (±0.1 percent).

Retail trade sales were up 0.7 percent (±0.5 percent) from August 2023, and up 3.0 percent (±0.5 percent) above last year. Nonstore retailers were up 8.4 percent (±1.6 percent) from last year, while food services and drinking places were up 9.2 percent (±2.3 percent) from September 2022.

As always, a reminder... "not for price changes", means not adjusted for inflation.


The term "resilient" continues to be overused, when clearly the actual "stuff" being bought is rather stagnant. 

That's not to say that last month's data was not an improvement, as both month to month and year over year were up... after adjusting for inflation. However, a rolling 12 month average indicates slippage of -0.1%, when adjusted for inflation.

That includes last September, which got revised downward... ever so slightly.


It should be noted, that today's report is +1.8% above January in current dollars, yet -1.1% when inflation adjusted. THAT is after all the revisions to January. Which begs the question... what will next month's backward revisions be.

You won't hear about it, as the mantra... "if it can't be spinned positively, ignore it." I am not saying the Census Bureau minions are at work here, but politicians and their friendly media darlings do.

I will continue to monitor thee monthly reports, however this is the last in this series.

Thursday, October 12, 2023

BLS Data Dump. CPI - October 12, 2023

First up is the BLS Report for CPI...(historical releases)

The Consumer Price Index for All Urban Consumers (CPI-U) rose 0.4 percent in September on a seasonally adjusted basis, after increasing 0.6 percent in August, the U.S. Bureau of Labor Statistics reported today. Over the last 12 months, the all items index increased 3.7 percent before seasonal adjustment.

The index for shelter was the largest contributor to the monthly all items increase, accounting for over half of the increase. An increase in the gasoline index was also a major contributor to the all items monthly rise. While the major energy component indexes were mixed in September, the energy index rose 1.5 percent over the month. The food index increased 0.2 percent in September, as it did in the previous two months. The index for food at home increased 0.1 percent over the month while the index for food away from home rose 0.4 percent. 

The index for all items less food and energy rose 0.3 percent in September, the same increase as in August. Indexes which increased in September include rent, owners' equivalent rent, lodging away from home, motor vehicle insurance, recreation, personal care, and new vehicles. The indexes for used cars and trucks and for apparel were among those that decreased over the month.

I had readings of 3.6%~3.9%, so the 3.7% was within that range.

The past 12 months...

My own CPI...
The C.O.L.A. was announced at 3.2%.

The results, compared to average S.S. income and various CPI methods. Once the average monthly S.S. is adjusted for Medicare Part B, the result is 2.9%.

Then compare the average 3 month of each CPI method, yields the headline CPI of 3.5%; Chained CPI at 3.6%; R-CPI-E at 4.1%; the end result of S.S. monthly minus projected Medicare part B... stands in sharp contrast to actual inflationary pressures.


'Nuff said!

This concludes my monthly publication of CPI.


BLS Data Dump. Real Earnings - October 12, 2023

The BLS has released the latest Real Earnings Report.

Real average hourly earnings for all employees decreased 0.2 percent from August to September, seasonally adjusted, the U.S. Bureau of Labor Statistics reported today. This result stems from an increase of 0.2 percent in average hourly earnings combined with an increase of 0.4 percent in the Consumer Price Index for All Urban Consumers (CPI-U).

Real average weekly earnings decreased 0.2 percent over the month due to the change in real average hourly earnings combined with no change in the average workweek.  

Real average hourly earnings increased 0.5 percent, seasonally adjusted, from September 2022 to September 2023. The change in real average hourly earnings combined with a decrease of 0.6 percent in the average workweek resulted in a 0.1-percent decrease in real average weekly earnings over this period.

I added emphasis to the decrease.

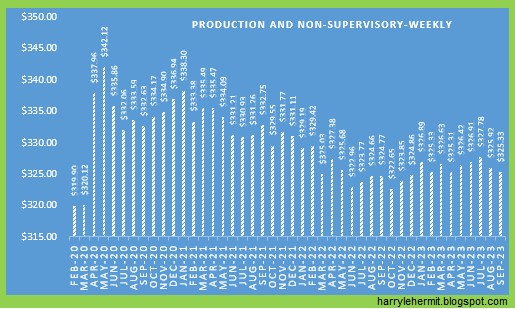
Graph time...


I suppose the good news... the Real Hourly is still +2¢ above pre covid, and down -2¢ from last month.

Real Weekly is +$2.08 above pre-covid, but down -71¢ from last month, AND... down -$1.10 from July.


The working stiffs are 14¢ above pre-covid on an hourly basis, yet down -1¢ from previous month, as well as down -7¢ from July.


The working stiffs are $5.43 above pre-covid on a weekly basis, yet down -59¢ from last month, and down -$2.45 from July.

The bad news, is all areas had a setback in inflation adjusted earnings in September. Let's hope that does not continue.

This closes out my publication of this data, although I will continue tracking. I'll just keep my thoughts to myself... unless I can't help myself.


Wednesday, October 11, 2023

Producer Price Index October release with September 2023 Data

The BLS has released the September Producer Price Index Report (historical releases) 

The Producer Price Index for final demand increased 0.5 percent in September, seasonally adjusted, the U.S. Bureau of Labor Statistics reported today. Final demand prices rose 0.7 percent in August and 0.6 percent in July. (See table A.) On an unadjusted basis, the index for final demand advanced 2.2 percent for the 12 months ended in September, the largest increase since moving up 2.3 percent for the 12 months ended in April. 

Leading the increase in the final demand index in September, prices for final demand goods rose 0.9 percent. The index for final demand services advanced 0.3 percent.

Prices for final demand less foods, energy, and trade services increased 0.2 percent in September, the fourth consecutive advance. For the 12 months ended in September, the index for final demand less foods, energy, and trade services moved up 2.8 percent.


As is often the case... there were revisions to previous month's data, so don't be surprised if this month's data is revised next month. The size of July's data was a bit surprising however. When that data came out, it was considered above expectations at +0.3%. A couple of month's later, it was revised to +0.6%, without any discussion.


In any case, I will continue to track, but this should wrap up publishing my thoughts.


Friday, September 29, 2023

Natural Gas Summary, UK, EU, USA... Week Ending 9-29-2023

The Energy Information Administration released their weekly report


At long last, all regions are above both last year and 5 year average. Hooray!
EIA.GOV via SNL Energy
Now for a look at The European Union and United Kingdom.

[The reason for this observation is LNG, which has introduced the prospect of U.S. Natural Gas prices being affected by global demand for LNG. The EU and UK serve as a benchmark for these demand issues.]

Time to wrap up the publishing of this weekly natural gas summary...


Review of August data and the September PCE Release

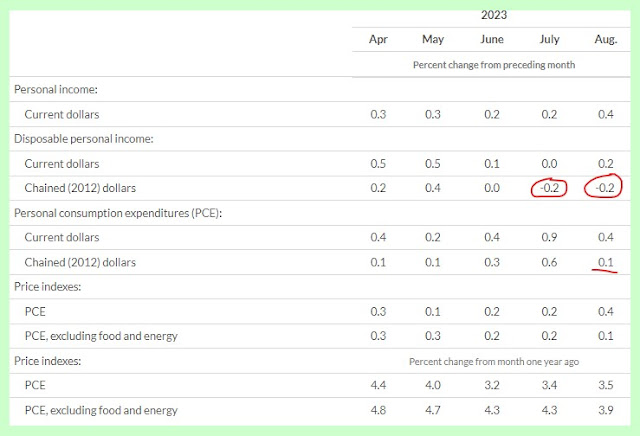
Yep, today's report was positive, with an uptick of +0.4%. That being in current dollars and when adjusted for inflation became... -0.2% for the month to month. The good news was the year to year inflation adjusted +0.1%. 

I did not denote the various changes from previous month's release, so but can be seen in previous publications.


It should be noted that multiple adjustments were made to previous readings, as indicated below...


The FED chain type report of PCE, excluding food and energy was adjusted to 2017 from previous 2012.


The 3.9% current, hearkens back to May of 2021, when things were transitory. The signs are pointing downward, but that 3.0% target remains distant, imho.

The scorecard for this month looks like this.

If I were grading this report, it would be 47.1%, compared to last month's 52.9%. Translation: My confidence in inflation heading towards 2.0% is not as great as some are predicting. 

Thursday, September 28, 2023

Quick Review of The GDP report 2Q-2023, 3rd estimate

First off, the base year for chained dollars is now 2017, instead of the previous 2012.

Secondly, there were revisions in past quarters, or updates. This is done annually. 

  • 2023 Quarter one GDP was revised upward, from 2.0% annualized, to 2.2% annualized.
  • 2023 Quarter one GDI was revised upward from -1.8% annualized to 0.5% annualized.

There are other changes, but that was a sampling.

While the chained dollar report for last month, based on 2012, showed the Real GDP at 20.387T, the new report based on 2017, is now 22.225T. 

However, there were significant reductions in the report, with Durable Goods being reduced, both on the personal consumption level and imports. 

Clearly there were large adjustments elsewhere to overcome those changes, such as in personal consumption services (quite large), Fixed Investment and Government consumption and Net exports of goods and services.

Nothing really out of line from expectations, although the Personal Consumption Expenditures for Goods was quite a drop from Quarter one. However, it is still positive and the drop was not quite a surprise, as the Monthly PCE report has been screaming a sharp decline.

1-17-2025 Week In Review

Laugh of the week Watching Sky News and a lady proclaimed that social media sites should be held to the same strict standards as newspaper p...