Friday, December 1, 2023

My Analysis Methods Regarding CPI and Weightings.

I was prompted recently, by the uproar of the inflation data and CPI "hiding" information. I think the information is there, but a lot of folks don't bother to read past the headline.

An example would be the food component.

To understand my recent research, understand an article was written by a mainstream media source that stated... the typical American family must spend $11,400 more now on the basics, compared to January of 2021. They cited the BLS data.

So the January 2021 BLS report, had the print at 261.582. The October 2023 BLS report, rolled in at 307.671. Overall, it shows inflation rose 17.619%, during that period.

If that family is spending $11.4K more, then they were spending at an annual rate of $64,700, in January 2021, compared to a current rate of $76,100. A difference of $11.4K or 17.619%.

This is the basic CPI print for food total, food at home, and food away from home...

Now that those conditions are understood... onto the weightings.

This is what happens, when the weightings are thrown into the mix...


Note that food overall is much less at 11.4%, than the first chart's 20.2%. However, food at home jumps to 29.4% from the former chart's 20.9%. Oddly, the actual food away from home spending has fallen -10.7% since January 2021.

We are spending much more on food at home, than the BLS numbers indicate. It is due to fluctuations in weightings. These fluctuations are found in almost, if not all... categories.


Thursday, November 30, 2023

Review of October 2023 data, GDP, PCE and personal income

Just some charts with a bit of commentary...


The headlines proclaimed a resilient consumer propelled the advance estimate of 4.9% annualized... to 5.2%. Seriously, the PCE slipped from 4.0% to 3.6%. You could toss in Residential investment, but you still come up lacking. 

It was a good report, but could have done without the spin, imho.


A couple of charts about PCE. Adjustments are in red. Again, a good report.

And to finish up the charts...

October ended up being an all around good month. May it continue.


Wednesday, November 29, 2023

This Week in Petroleum Summary 11-29-2023, per EIA.GOV

Just some charts to summarize today's report...

Gasoline prices have continued to fall, BUT seem to be nearing an end, imho.

Overall, the inventory numbers gained across the board, including the SPR. 


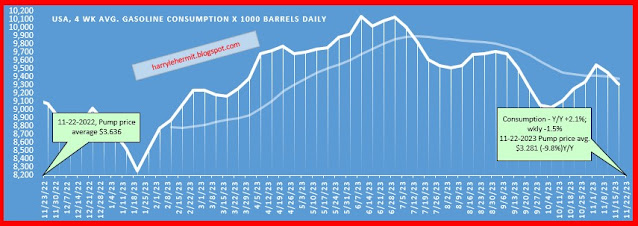
Consumption of Gasoline is slipping, but still slightly above year ago levels. 

The drop in gasoline prices should drop the CPI to -0.3% month to month and +3.0% on the year. It is a seasonal thing.

Saturday, November 25, 2023

A Foray into the 2024 Presidential Election, Part Three

In part two, I did a quick peak at current polls, based on just D v R.

Part 3 adds independents, etc., into the mix, although impact is just D and R...


Certainly, my methodology is not very scientific, but it would appear the Kennedy factor is actually harming Trump, more than Biden, although both trend lower with the inclusion of Kennedy.

At this point, Kennedy does not appear anywhere near getting even 1 electoral vote, but the potential to drag voters away from either major party's candidate is possible. However, as stated previously, the impact appears more on the Republican side, rather than the Democrat side. Most notably in Arizona, North Caroline, and Pennsylvania.

The one thing about polls, is people do tend to wish for one thing during poll season, but will vote their party at election time, if republican or democrat. 

Independents might switch back and forth, but generally vote for which major party candidate makes them feel better, or rather... less worse.

Friday, November 24, 2023

A Foray into the 2024 Presidential Election, Part Two

A quick update on my latest review of polls and the presidential election.

A lot of time remaining and things could change. Currently, Biden is slipping in these states, with the exception of Virginia. 

Trump is also slipping in a few states, such as Pennsylvania, Nevada, Iowa, Florida and Arizona. He is easing up in Michigan and North Carolina. 

IF the election were today, Trump would get 302 EVs, to Biden's 236. The safety numbers seem to be 235 for Trump and 226 for Biden. 

All of this is assuming that Trump will be the eventual republican nominee and Biden will be the democrat nominee. 

Realistically, Trump would be disruptive to the election, if he were not the republican nominee, and there is no one ready among the democrats, to step in for Biden.

We are stuck with these as the selections, although 3rd party involvement could be a factor, as things stand now. RFK Jr. does seem to be polling some double digit numbers, which appear to be affecting both D and R in the polls. 

While it is sad to think these are the options, it is fun to watch the hysteria.

Wednesday, November 22, 2023

1-17-2025 Week In Review

Laugh of the week Watching Sky News and a lady proclaimed that social media sites should be held to the same strict standards as newspaper p...