Friday, August 23, 2024

My electricity bills over time (August, 2024 Edition)

My electricity usage over time. I track many things to monitor my inflation versus the CPI.


The July bill came in much higher than last year. +24.5% from same month, last year. Granted, it is bill only, not adjusted for days in the reading, etc.

As for the rolling 12 month average...


The number of days, as well as temps were the main factor, as the cost per KWH, was 12.77¢, versus last year's 12.83¢.

Finally, we have had a bit of cool down, but that is ending this weekend. Have to wait until next month to see any downward movement.


Wednesday, August 21, 2024

This Week in Petroleum Summary August 21st, 2024 per EIA.GOV

This week's full report

Gasoline pump prices fell -4.7¢ for the week, and continues well below year ago levels, by -46.7¢, or -12.1%. Days supply was steady at 24.2. For perspective... last year was also 24.2 days.


Inventories fell across the board, with crude down -4.6M barrels; Distillates slid -3.3M barrels; Gasoline down -1.6M barrels. Total Petroleum + products +SPR slid -5.2M barrels, with the SPR rising +636K barrels.

Despite the draws, the total products is still +46.75M barrels ahead of year ago levels.


For those interested, the exports of Crude, Petroleum Products, Including Gasoline has far outweighed the imports, by this much, since March, 2022.


The current crack spread has slid further from last week's $21.12, to $18.67. Gasoline at $10.08 from last week's $12.44. Distillates to $8.60, compared to last week's $8.68.

With the overall spread easing, it is difficult to imagine the pump prices not edging lower. 

The question is why? Despite the drop in inventories, the price of crude and gasoline on the futures market... is sliding to levels not seen since late 2023. Similarly for gasoline, even with inventories holding steady to year ago levels, with consumption even. 

The almighty dollar, which crude futures are stated as, has dropped to levels, also not seen, since end of 2023.

While the U.S. consumption is steady, I get the uneasy feeling that in a supply/demand world... the demand is slipping.

It is that slippage, that makes me wonder if a slowdown is in the offing and where might it be coming.

Saturday, August 17, 2024

2024 Presidential Election Update, August 17th Edition

The race continues to somewhat tighten, with the electoral vote forecast now having Trump/Vance with 235 to 213 for Harris/Walz. The toss-ups are now at 90. The latter being Wisconsin narrowly sliding into toss-up range last week.

Throwing the toss-ups into the mix, results in Trump/Vance 301:237 Harris/Walz. The change from last week, was Arizona moving from a slight edge to Trump/Vance, to a slight edge for Harris/Walz.


The Harris/Walz lead in Arizona translates to about 10,362 votes. Biden/Harris won the state in 2020, by actual 10,457 votes.

So yes... it is getting interesting!

Thursday, August 15, 2024

Advance Retail Sales Report- August 15th, 2024

Advance Monthly Sales for Retail and Food Services, July Report

Advance estimates of U.S. retail and food services sales for July 2024, adjusted for seasonal variation and holiday and trading-day differences, but not for price changes, were $709.7 billion, an increase of 1.0% (±0.5 percent) from the previous month, and up 2.7 percent (±0.5 percent) from July 2023. Total sales for the May 2024 through July 2024 period were up 2.4 percent (±0.5 percent) from the same period a year ago. The May 2024 to June 2024 percent change was revised from virtually unchanged (±0.5 percent)* to down 0.2 percent (±0.2 percent)*.

As for those revisions...


So a big upward month, after all the previous month's downward revisions.

When adjusted for inflation...


Of course the current unadjusted number (709,668) is similar to December 2023 original advance report (709,890), which has been revised downward to current 703,256.

Even with all the revisions, today's release appears to be a sharp uptick from previous months, but still following a near flat line pattern, when factoring inflation.

Digging into the data... Sales advanced $6.806B from previous month. $4.703B was in the autos, a rebound from previous month, due to cyber attacks.

That leaves $2.103B. The downward revision from previous two months of -$1.636B and upward revision of April (+$0.010B) leaves a net gain of $477M.

That explains away about 93% of that "stellar" report.

Not exactly sure how that qualifies as stellar, but okay, what's done is done... until next month's round of revisions.
 

Wednesday, August 14, 2024

This Week in Petroleum Summary August 14th, 2024 per EIA.GOV

This week's full report

Gasoline pump prices fell -1.4¢ for the week, and continues well below year ago levels, by -40.6¢, or -10.5%. Days supply rose from 24.7, to 24.2. For perspective... last year was 24.1 days.


Inventories were mixed across the board, with crude up +1.4M barrels; Distillates slid -1.7M barrels; Gasoline down -2.9M barrels. Total Petroleum + products +SPR slid -2.4M barrels, with the SPR rising +694K barrels.

Despite the mix of draws, the total products is still +49.5M barrels ahead of year ago levels.


For those interested, the exports of Crude, Petroleum Products, Including Gasoline has far outweighed the imports, by this much, since March, 2022.


The current crack spread has slid further from last week's $22.53, to $21.12. Gasoline at $12.44 from last week's $13.19. Distillates to $8.68, compared to last week's $9.33.

With the overall spread easing, it is difficult to imagine the pump prices not edging lower. 

Time to take a break and wait on tomorrow's Advance Retail. Money says prior months are revised downward, thus the advance can show an upswing. 


BLS Data Dump. CPI - August 13th, 2024

First up is the BLS Report for CPI...(historical releases)

The Consumer Price Index for All Urban Consumers (CPI-U) increased 0.2 percent on a seasonally adjusted basis, after declining 0.1 percent in June, the U.S. Bureau of Labor Statistics reported today. Over the last 12 months, the all items index increased 2.9 percent before seasonal adjustment.

The index for shelter rose 0.4 percent in July, accounting for nearly 90 percent of the monthly increase in the all items index. The energy index was unchanged over the month, after declining in the two preceding months. The index for food increased 0.2 percent in July, as it did in June. The food away from home index rose 0.2 percent over the month, and the food at home index increased 0.1 percent. 

It was a bit below the expectations of 3.0% on the annual, and the 0.2% was seasonally adjusted up from the actual 0.116%. So not so bad, and in fact... fairly decent.

For the record: February 2021, 1.7%; March 2021, 2.6%. 

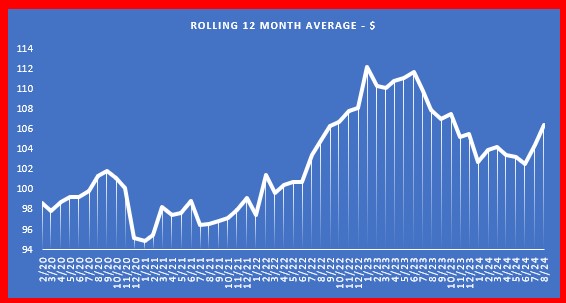
Here is the unadjusted CPI for the past 12 months...

My own personal CPI rose 3.0% Y/Y, but slid -0.2% on the month (I'm happy with that) ...

Taking a look at the current report card...


My inflation rate is slowing, but following several years of my personal inflation being below the COLA, I am not so happy, with the current outlook.

That's it for this month's CPI... maybe!

Uhoh!! Edited at 10:30PM, 8-14-2024. changes made to COLA projections, based on +0.1%~+0.2% August projection and September at -0.1%~+0.1%. The likelihood of 2.5% COLA is now very likely. imho.

BLS Data Dump. Real Earnings - August 13th, 2024

On to the Real Earnings.

Harkening back to February 2020, when the real hourly rate was $11.02, that rate is now $11.19 for hourly- private non farm payrolls, seasonally adjusted...  


Whereas real  weekly earnings for that same cohort has moved from $378.92 to $382.54, down from last month...


For the real hourly earnings of Production and Non-Supervisory of $9.49 in February 2020, is now $9.80. Up 1¢ from last month's report...


The real weekly earnings for this group moved from $319.90, to 330.40. Down 50¢ from last month...


All the above data is based directly on the CPI-U to get the "real" component. 


Comparison of Inflation in selected countries- September, 2024 Edition

With the United Kingdom, Canada, and EUstats release of June data, I have updated my comparison graph.  [ Note, the USA(EU method) is direct...