This week's full report.
Gasoline pump prices fell -1.4¢ for the week, and continues well below year ago levels, by -40.6¢, or -10.5%. Days supply rose from 24.7, to 24.2. For perspective... last year was 24.1 days.


Inventories were mixed across the board, with crude up +1.4M barrels; Distillates slid -1.7M barrels; Gasoline down -2.9M barrels. Total Petroleum + products +SPR slid -2.4M barrels, with the SPR rising +694K barrels.
Despite the mix of draws, the total products is still +49.5M barrels ahead of year ago levels.

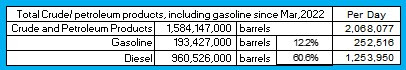
For those interested, the exports of Crude, Petroleum Products, Including Gasoline has far outweighed the imports, by this much, since March, 2022.

The current crack spread has slid further from last week's $22.53, to $21.12. Gasoline at $12.44 from last week's $13.19. Distillates to $8.68, compared to last week's $9.33.
With the overall spread easing, it is difficult to imagine the pump prices not edging lower.
Time to take a break and wait on tomorrow's Advance Retail. Money says prior months are revised downward, thus the advance can show an upswing.