The monthly summary continues to improve, although PCE ex food and energy inflation numbers continue to be a concern.
Friday, September 27, 2024
Review of August 2024 data, 2Q GDP, PCE and personal income
Wednesday, September 25, 2024
This Week in Petroleum Summary September 25th, 2024 per EIA.GOV
This week's full report.
Gasoline pump prices fell -0.2¢ for the week, and continues well below year ago levels, by -66.8¢, or -16.5%. Days supply slipped to 24.9. For perspective... last year was 25.5 days.
Saturday, September 21, 2024
2024 Presidential Election Update, September 21st Edition
The race continues to somewhat tighten, with the electoral vote forecast having Trump/Vance with 245 to 226 for Harris/Walz. The toss-ups are now at 67, with an edge still favoring Trump at 46 and Harris at 21. Thus, Trump at 291 and Harris at 247. 270 is needed to win. 45 days to go.
While Harris finally moved up on the electoral count, it was more of Virginia moving out of the Toss-up range in her favor.
While nothing is firm until after the election... Trump seems to have a firmer grip on 245 EVs, with the following odds in a few other states.
Arizona - 11 EVs... Trump with slim edge, at 60%
Georgia - 16 Evs... Trump with the edge, at 85%
Michigan - 15EVs... Harris with a razor thin edge
Nevada - 6 EVs... Harris, razor thin, but edging up.
Pennsylvania - 19 EVs... Trump odds of winning - 73%, down sharply from last week
Those represent 67 EVs. Harris needs 3 of the 5, whereas Trump needs 2.
Harris has taken the lead in the national composite... 49.9 ~ 49.6. In 2016, Clinton led Trump 42.0 ~ 40.3. In 2020, Biden led Trump 50.3 ~ 43.5
Friday, September 20, 2024
Comparison of Inflation in selected countries- September, 2024 Edition
With the United Kingdom, Canada, and EUstats release of June data, I have updated my comparison graph. [Note, the USA(EU method) is directly from Eurostat]
Thursday, September 19, 2024
My electricity bills over time (September, 2024 Edition)
My electricity usage over time. I track many things to monitor my inflation versus the CPI.
Wednesday, September 18, 2024
This Week in Petroleum Summary September 18th, 2024 per EIA.GOV
This week's full report.
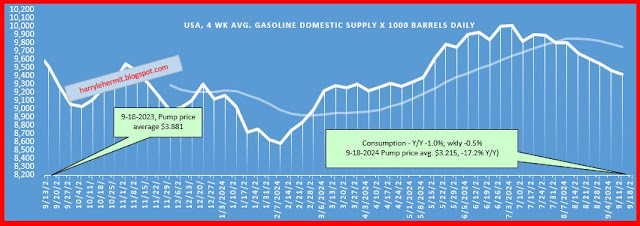
Gasoline pump prices fell -3.0¢ for the week, and continues well below year ago levels, by -66.8¢, or -17.2%. Days supply edged up to 25. For perspective... last year was 24.8 days.
Tuesday, September 17, 2024
Advance Retail Sales Report- September 17th, 2024
Advance Monthly Sales for Retail and Food Services, August Report.
Advance estimates of U.S. retail and food services sales for August 2024, adjusted for seasonal variation and holiday and trading-day differences, but not for price changes, were $710.8 billion, an increase of 0.1 percent (±0.5 percent)* from the previous month, and up 2.1 percent (±0.5 percent) from August 2023.
Note the numbers are not adjusted for inflation. Keep in mind, the BLS listed the annual inflation rate of 2.5%
First up, the revision history (might need to click on, to up scale)...
The historical numbers, also with adjustments for inflation...
After last month's "stellar" report, which was mostly from revisions and other items, this month is tame.
There were winners and losers, however. The biggest sales numbers come from the auto sector, which faded a bit over the past month in adjusted sales, and is below the annual.
The next biggest sector is food and beverage stores, which also saw a decrease in adjusted sales. General merchandise continued that trend, with department stores sales for adjusted monthly and annual falling.
Food services and drinking establishments held steady for the monthly adjusted.
Mail order companies, continue to outpace nearly all others.
A FEW CHARTS WITH SOME POLITICS - January 07, 2026
The crude inventories are in good shape for this time of year... It should be noted that the total inventory of Petroleum and Petroleum prod...

-
Reviewed this weeks EIA report and observed the current status of inventories. Oddly, although domestic consumption is down from last year,...
-
This week's full report . Gasoline pump prices rose +1.4¢ for the week, but continues below year ago levels, by -3.2¢, or -1.2%. Days...
-
Today's EIA.gov report . Crude stocks up again, +7.6M barrels, from last week; Distillates up +2.7M Barrels; and Gasoline slid -1.9M b...


