Wednesday, April 13, 2022

Producer Price Index for March 2022


The Producer Price Index for final demand increased 1.4 percent in March, seasonally adjusted, the U.S. Bureau of Labor Statistics reported today. This rise followed advances of 0.9 percent in February and 1.2 percent in January. (See table A.) On an unadjusted basis, final demand prices moved up 11.2 percent for the 12 months ended in March, the largest increase since 12-month data were first calculated in November 2010.

I wish I could see a silver lining, but with the input costs remaining above the demand stage levels... hard to do.

Supply chain and harbor congestion. It would appear the west coast congestion is easing, but it also appears the backlog has been shifted to east and gulf coast regions. Intermodal is still struggling with congestion and we all have heard the dire warnings of truck driver shortages. 

I can't help but think that just-in-time is dead and has been replaced by just-in-case. Which would mean a whole lot of inventory build-up staring into the potential abyss of consumer pullback in purchasing.

A better view of that, might come with tomorrow's advance retail sales outlook... which will contain numerous revisions.


Tuesday, April 12, 2022

Breakdown of CPI DATA and Real Earnings, March 2022


The BLS report for March...

The Consumer Price Index for All Urban Consumers (CPI-U) increased 1.2 percent in March on a seasonally adjusted basis after rising 0.8 percent in February, the U.S. Bureau of Labor Statistics reported today. Over the last 12 months, the all items index increased 8.5 percent before seasonal adjustment.

From last Month...  

The forecast for March is a bit blurry, due to energy prices, but the expectations would be 8.2% ~ 9.1%. I would unhappily lean towards the 8.7% range, just based on the rapid rise of gasoline during this month, although it may be peaking as I type. I would expect the upward trend in food prices to continue. 

With this release comes a variety of other numbers...

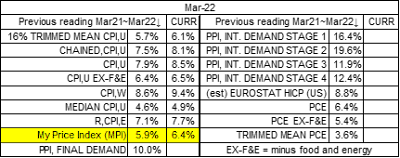
I am unhappily at 6.4%...

Like many, my food inflation is creeping up. I am able to stay below the headline number, due to some things I don't do. I don't buy a new car, so that 12.5% inflation does not impact me. I do estimate the replacement of my used car, but I would not purchase a used car outright. So I adjust the difference with a trade in... which oddly sees my trade in value also increasing, albeit not as fast as the used vehicle to be purchased. But still the inflation rate is significantly lower than 35.3%.

I should also mention that health costs have thus far inflated at a much lower rate, which still worries me. Hopefully I don't become sick with worry.

On to earnings report... (REAL means over and above inflation... or sometimes below)
This is the 3rd straight month of declines, with it nearly back to February 2020 levels. (Note, I have not adjusted all the adjustment the BLS has made... so it may be more.)

The 4th consecutive month of declines in weekly wages. 

Going forward, it is getting even harder to forecast inflation, as several variables are at play. It would appear that many consumables are starting to slow, which would indicate a potential for slowing of inflation in that area. But then again, China is in lockdown in so many places that further supply disruptions are possible.

Gasoline costs may abate, but likely due to decreased demand and the aforementioned China slowdown. 

Food is the one area that will continue to see inflation, as all manner of issues are arising. 

I can fairly confidently (and sadly) state that April numbers due out in May, will likely be north of 8.0%, such as between 8.0% and 8.5%. 

EDIT: just hours after writing this, the Chinese are loosening the lockdown and crude and gasoline prices have taken off. We'll see where this leads.


Sunday, April 10, 2022

Consumer Price Index and an Attempt to Examine a Couple of Income Groups


Bear with me, as I explain the 2 groups. 

Group one would be more applicable to middle income before taxes, with spending power of about $77,681 after taxes. This seems to be the median or average of CPI spending, considering household size, etc. The before tax income and before savings rate places the income over $100K, in my estimation. The $77,681 spending is applicable to CPI.

Group two would be more applicable to lower middle class, with purchasing power of about $47,000 with all other factors such as persons in household, etc. Approximating income level as being near Middle class low of $60,319, before taxes and any meaningful savings. The bottom line drops back to $47,000

The intent is to indicate the impact of inflation on two groups of middle income households. It should be a given that lower middle class and poor or near poor, would be impacted much more.

The $77,681 is to be considered the spending of an average household on the CPI scale. (It may be lower, but the end principle remains the same.)

This chart highlights "some" spending habits of this group...
While food is 13.388% of spending for this group, the second group is about 22.128%. Let's see how their lower spending shows up...
Here the spending on other stuff is curtailed, compared to the upper middle income group. While the accuracy of my numbers might not be completely accurate, they do portray a significant difference in decision making of what to spend money on. 

An that was just the two extremes of the "middle income" group. I should point out that 40% of the purchasing items for the upper middle income group has been omitted. That lower middle income group will need to cut back on the highlighted 4 items to partake of that other 40%. 

Those cutbacks are even more extreme for the lower middle class, the poor and near poor. In a way, the inflation rate for the lower middle income group is probably closer to 9.8% annual, compared to the 7.9% for the upper middle income group. Worse (higher inflation) down the income scale.

Economists debate when inflation will begin to recede. A lot depends on the public's willingness to spend, go further in debt, etc. It is about supply and demand. When supply exceeds demand, prices will begin to fall and of course, the reverse has prices rising. 

At this point, I would speculate that demand will fall across many categories as the supply catches up. However, the demand for food will continue to increase as the global population grows. That supply has been limited for various factors, such as supply chain bottlenecks, covid strapped suppliers AND Global weather patterns... such as too much rain during planting season and not enough rain during growing season. 

Going forward, the price of inputs for crops was escalating prior to Russia's invasion of Ukraine. Food is a global commodity, so any threats to crop production have a global impact. 

We can expect food prices to continue to climb, with the poor, near poor and lower middle class being impacted even further. Some hard decisions will have to be made by these groups and they will not be very happy about those decisions. That American Dream is moving further and further away, imho. 


Thursday, March 31, 2022

End of the Month... So February 2022 Inflation Numbers and Other Stuff.


With the PCE index report this morning, we can wrap up all the February inflation numbers. Granted, some slight improvement was seen in some areas, but still double digit increases on the upstream models seem to suggest more inflation to the consumer.

There does seem to be some potential for deceleration in core inflation, as decreased purchasing power is becoming more widespread. Inventories of retail and wholesale have increase ahead of inflation. Normally this could be seen as wonderful news, but it is hard to keep a straight face over lingering claims of supply chain shortages and increases in inventories, in my opinion. 

We all know that supply v demand is the determinant of pricing. If demand goes up and supply can't keep up... prices increase. Demand falls and supply increases... prices decrease. The past year saw demand pumped up with various stimulus checks and which contributed to "supply chain" issues. The benefit of that additional money is waning as retail sales minus inflation are flat to lower. Even more so with energy and food pulled from the equation.

As stated, core items might fall in the coming months, but what about energy and food?

Energy is struggling to supply to meet the demand. Regardless of any Strategic Petroleum Reserve activity... the demand will need to decrease for price relief. Going into the summer driving season, I am not so sure that will take place before August. Besides, that 1-million-barrel daily release will likely be exported, which may have impact on global prices, which may in turn trickle down to the US Consumer... eventually. We must remember the previous release announced last fall has not yet been completed. The 30 Million barrel release announced in March has not started, so just how quick will this happen?

Maybe in time for the midterms, but then you have the other headline issue...

Food, which accounts for about 14% of the Average American expense, compared to 8% for energy (>4% for Gasoline). Food is the one item that rarely sees a decline in demand and usually an increase as the global population is still growing. It really is all about supply and weather impacts of the past couple of years has NOT been conducive to slowing food price inflation. Throw in the Ukraine invasion and this is not an area that will likely seen any leveling off unless we get a good global weather pattern for crops and peace breaks out quick in war torn areas. 

Food is likely to be the issue for the next couple of years. A case could be made that Russia invaded Ukraine to control its large agriculture industry, to which it could use as influence amongst its friends, etc. Whatever the reason, it has clearly backfired, and the global community will become increasingly unsettled over food insecurity.

We will likely see the CPI in the mid 8% range in March's report and higher the following month. Much will be made about the high price of gasoline, but the food component is the real long-term story.

Forget the Oscars, as inflation is about to give us all a slap in the face. 

Thursday, March 17, 2022

Time For an Update on Petroleum Inventories? 3-17-2022


What I am about to say, should be prefaced with this from the EIA...Oil and petroleum products explained. Scroll to this heading...Petroleum products produced from one 42-gallon barrel of oil input at U.S. refineries, 2020.

Note this is the end product average of multiple types and grades of petroleum. Some crude types are present a more efficient gasoline refinement, while others might lend themselves more easily to distillates, etc.

So the input mix, to provide the output demand, based on cost efficiency. As long as the output is matches demand, the world is a much friendlier place.

I suspect that the demand is not matching the input at this time, although I have no data to support that notion. The crude inventory might be 415M barrels... but what types of crude? And how does that match with the most efficient refining mix to provide the current demand?

Oddly, the gasoline inventory are almost spot on with inventories of this time in 2019. Crude inventories are -5.4% below this time in 2019, but the distillates are -13.6% below this time in 2019. Granted there is a big difference in import and export of distillates, but that has been a factor for several years. 

While I am trying to wrap my head around all this, I should note the distillate production is below this time of 2019 levels and the exports are creeping above those 2019 levels. 

So it would seem that more distillates must be produced, while maintaining gasoline stocks, which would then require more barrels of oil. See where this is headed? UP! I would not be surprised if crude prices won't below $90 until late summer. Which will also see a slide of national average gasoline drifting back to about $3.85. That's if... a recession doesn't break out.

Wasn't that joyous?!?

Wednesday, March 16, 2022

Retail Trade Report for February 2022


Advance estimates of U.S. retail and food services sales for February 2022, adjusted for seasonal variation and holiday and trading-day differences, but not for price changes, were $658.1 billion, an increase of 0.3 percent (±0.5 percent)* from the previous month, and 17.6 percent (±0.9 percent) above February 2021. Total sales for the December 2021 through February 2022 period were up 16.0 percent (±0.7 percent) from the same period a year ago. The December 2021 to January 2022 percent change was revised from up 3.8 percent (±0.5 percent) to up 4.9 percent (±0.2 percent).
The report does note the impact of higher gasoline prices, but remember this is for February and spending at gasoline stations was about 1/2 of that miniscule 0.3% before inflation adjustments. Whether you believe it or not, gasoline prices nationally rose on 8% from January to February and are currently about 22% higher than February. 

Of course, the report does not factor in inflation, which is indicated on the graph above. It should be noted the orange dots are calculated on the average CPI data. It should come as no surprise that we are paying more for less. In the 11 months since March 2021... we are paying 5.62% more for -1.39% less, on an adjusted basis.

One of the things I have considered, is that stimulus may have contributed to some of the inflation and certainly the huge jump in purchases. I suspect that money has been spent and we are now approaching fumes. That is in no way meant to imply that inflation will start to recede.

Far smarter minds than me, indicate inflation peaking around April, which will be reported in mid May. Any deceleration would follow a month later. A lot of that prognostication is based on forecasts in other areas, that might get revised. 

So hang on!!!

Tuesday, March 15, 2022

Producer Price Index for February 2022


The Producer Price Index as released by the BLS, this A.M. 

The Producer Price Index for final demand increased 0.8 percent in February, seasonally adjusted, the U.S. Bureau of Labor Statistics reported today. This rise followed advances of 1.2 percent in January and 0.4 percent in December 2021. On an unadjusted basis, final demand prices moved up 10.0 percent for the 12 months ended in February.

In February, the advance in the index for final demand can be attributed to prices for final demand goods, which rose 2.4 percent. The index for final demand services was unchanged. 

The upward track continues, although many areas within the stages are starting to slip behind. Unfortunately the Energy and Food sectors are not among that slippage. 
Energy as in crude oil has slipped back from the $130+ range of a week ago and are now in the $105 range. The national gasoline average soared to $4.35 on March 10th and is tailing off ever so slightly to $4.31 at this point. In theory, the price should fall to $3.95 range over the next 2 weeks. 

However, while gasoline stocks are in the somewhat normal range for this time of year, the upstream crude stocks are below, as well as distillate stocks. Which points to a possible imbalance in crude grades for feedstock, which would point to higher refining costs, or so it would seem to this hillbilly.

In any case, demand will likely pick up going into the summer driving season. Supply v demand.

As for food, beef input costs aren't ramping up as much as other meats, but once again... grilling season is upon us. As for Pork... input costs are running about 25% higher than this time last year. Poultry is even higher. Feed and nutrients are the main drivers, with a potential bird flu outbreak causing some concern. 

The feed issue is being hammered by poor crop conditions over the past couple of years and some of the biggest producers are hampered by bad weather. As some of the exporters have been reducing exports, big importers have gone on a buying binge. 

Then came the invasion. Although you may hear something different in the months ahead. Just sayin...

Tomorrow is retail sales, which will require cutting through a ton of revisions, imo.

A Foray into the 2024 Presidential Election, Part XVI

Really not seeing any major shifts, although the Minnesota margin widened ever so slightly. Still too difficult to read. The unadjusted poll...