Wednesday, January 17, 2024

1/17/2024, Advance Retail Sales Report for December Data

Advance Monthly Sales for Retail and Food Services, December Report.

Advance estimates of U.S. retail and food services sales for December 2023, adjusted for seasonal variation and holiday and trading-day differences, but not for price changes, were $709.9 billion, up 0.6 percent (±0.5 percent) from the previous month, and up 5.6 percent (±0.7 percent) above December 2022. Total sales for the 12 months of 2023 were up 3.2 percent (±0.4 percent) from 2022. Total sales for the October 2023 through December 2023 period were up 3.9 percent (±0.4 percent) from the same period a year ago. The October 2023 to November 2023 percent change was unrevised from up 0.3 percent (±0.3 percent)*.

Hmmm...  "Total sales for the 12 months of 2023 were up 3.2 percent (±0.4 percent) from 2022." The BLS listed that same period as having inflation of 3.4%. Which means the seasonal variation and trading-day differences have come into the equation. Otherwise, sales were up a bit more than indicated, imho.

First up the revisions...


We continue a pattern of previous months being revised downward, so the monthly changes are somewhat suspect.

When adjusted for inflation, the annual shows an improvement of +2.2%. The January numbers will be quite interesting, imho. The January report, adjusted for inflation, is slightly above the December number with inflation adjustements. Revisions will likely take place. 😒

The inflation adjusted chart looks like this...


The quantity of goods has not yet matched the highs of both March and April of 2021 and 2022. It will be interesting to see if a seasonal repeat is in store for early spring.

Mail order, vehicles and general merchandise led the way, with $4.305M of the $3.909M increase. That means there were some losers. Gasoline was down -$691M. The rest were slightly above or slightly below.

Seasonal factors likely drove the mail order and general merchandise, so can't reasonably expect a repeat in January. Gasoline currently remains relatively flat, compared to December.

Like I said... the revisions for January's report should be very interesting.

Friday, January 12, 2024

Producer Price Index January release December 2023 Data

The BLS has released the December Producer Price Index Report (historical releases)

The Producer Price Index for final demand fell 0.1 percent in December, seasonally adjusted, the U.S. Bureau of Labor Statistics reported today. Final demand prices moved down 0.1 percent in November and 0.4 percent in October. (See table A.) On an unadjusted basis, the index for final demand rose 1.0 percent in 2023 after increasing 6.4 percent in 2022.

If the PPI is really a forerunner of consumer inflation, then CPI should continue to ease, as PPI has nearing same rate as CPI in the periods outlined below.


I would hope the drops in food and energy will continue, or at least stabilize. I suspect energy will creep up in the coming months, as this is a seasonal lull, according to previous December reports. Those same reports suggest a seasonal lull for foods.

I guess it is important to find the good news and celebrate... however fleeting it might be.

Thursday, January 11, 2024

A Foray into the 2024 Presidential Election, Part IX

I previously posted that unless the EVs changed, I would attempt to avoid posting. They have changed.

The main change was Pennsylvania easing a bit from the (R) candidate. Simply put... the polls indicate a slight edge to DEM, but historically has under-reported REP votes in general elections, by 3%. Even with that latter adjustment, the result falls into the margin of error. 


Possibly some further shifting in weeks ahead, although the next polls might swing in the other direction.

IF the toss-ups are indeed DEM, then the issue would still be another 19 EVs for a DEM victory. That is possible, but quite an uphill battle, imho. However, the voting public can be quite fickle.


BLS Data Dump. CPI - January 11, 2024

First up is the BLS Report for CPI...(historical releases)

Not sure what the hoopla is about, regarding coming in hotter than expected. Factoring the rounding, it was just a few basis points above my expectations.

The index for shelter continued to rise in December, contributing over half of the monthly all items increase. The energy index rose 0.4 percent over the month as increases in the electricity index and the gasoline index more than offset a decrease in the natural gas index. The food index increased 0.2 percent in December, as it did in November. The index for food at home increased 0.1 percent over the month and the index for food away from home rose 0.3 percent. 

I highlighted a portion of that statements, as it is weird as heck. Gasoline in the November report was 297.598 and December gave a 280.289. Granted that is "unadjusted", but seriously... where did the increase in gasoline index come from? Nationally, the prices are down from last month, about 18¢ and down about 9¢ from December of 2022. Yet, somehow the "seasonally adjusted" edged up enough to offset something else.

Even by the BLS numbers from December, 2022... gasoline fell -1.5% (unadjusted)  on the month and was -9.4% on the seasonal adjustments. December, 2023... saw gasoline fall -1.9% on the unadjusted monthly, ... but rose +0.2 of the seasonal adjustments.  

In any case, the top number has decreased for 3 consecutive months. Now that would be seasonal, as November and December of 2022... saw decreases. It reversed in the January 2023 report.

My own personal CPI looks like this...
That is a +2.2% increase annually, and +0.1% for the month.

As for Real Earnings.


Remember when covid disrupted everything and massive shutdowns, layoffs, etc. Comparing that $380.95 real weekly earning, compared to February, 2020's $378.92. 

It is better than nothing!

This Week in Petroleum Summary January 11th, 2024 per EIA.GOV

This week's full report.


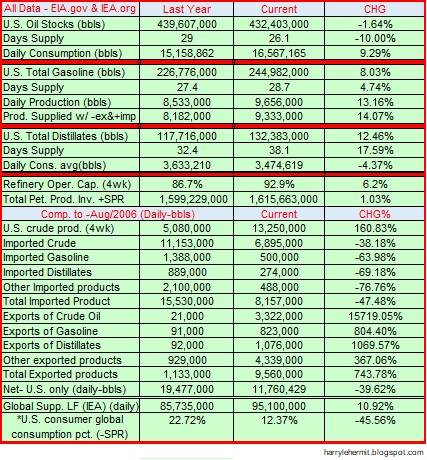
Consumption continues to edge up on a yearly basis, when  adjusting for inventory. Weekly, consumption has slid 2 consecutive weeks, similar to previous years. We'll need to see if seasonal patterns continue in the next couple of weeks... and beyond.


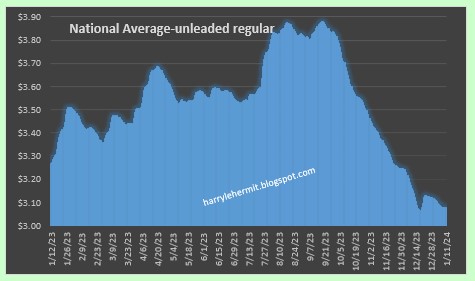
Pricing continues to remain stable...


The overall picture...

Crude inventories increased +1.3M barrels; distillates up +6.5M barrels; gasoline up +8M barrels.

For those interested, the exports of Crude, Petroleum Products, Including Gasoline has far outweighed the imports, by this much, since March, 2022.


Looks like good news, but will it continue?


Friday, January 5, 2024

A Foray into the 2024 Presidential Election, Part VIII

Onward and upward, or something akin to that adage.

As I delve further into the 2024 election process, I should briefly review previous posts, where I alluded to polls being wrong, but consistently wrong in the 2016 and 2020 General Elections. Further review... indicated those tendencies back to the 2000 election. 

Why, I don't know, but gave some ideas. 

It should be noted that evaluation of previous general election polling trends, really did not get reviewed until the party nomination was largely settled. More into Spring until the general election. The assumption of the 2024 nominations being settled, is a bit of fantasy. 

Currently, it would be hard to disagree with the following chart, as to which states are almost certain to fall into one column, which leaves 188 toss-ups. I allowed for Maine and Nebraska, due to split electoral voting system.


Speaking of Maine and Nebraska, it is likely that the single votes in the toss-up column will go blue or red. Thus the R-149 and D-203.

The variance chart...


Texas seems to be in the toss-up column, although not sure why. This is somewhat due to the tendency of polls to slightly understate the democrat votes. Still, the state falls into republican territory quite comfortably. Now it is R-189 and D-203.

Florida is next up and the polls for the state, tend to slightly overstate the democrat support, while understating the republican support. Thus Florida with its 30 EVs moves the needle to R-219 and D-203.

Virginia (13) keeps getting into the toss-up category. It puzzles me as to why, as it will very likely vote the democrat candidate and has a stellar polling v result score, imo. Thus R-219 and D-216.

I will lump Arizona (11) and Georgia (16) together, as they both have been consistently correct in polling matching outcomes. Polls seem to indicate a fairly strong republican tendency, which translates to R-246 and D-216.

Might as well get Wisconsin (10) out of the way. Of all the states with polling discrepancies, compared to results... Wisconsin is very high on the list, with a 6.5 variance, which tends to favor republicans. Polling greatly underestimates republican support and overestimates democrat support, when compared to general election results. Having stated that, the narrow polling margin, which is slightly in favor of Trump, indicates R-256 and D-216.

That leaves 66 electoral votes to decide the election. 

I haven't even gotten to North Carolina (16), which appears almost certain to fall into the R column. Now it is R-272 and D-216.

Now for Michigan (15) and Pennsylvania (19). Two states, which closely follow Wisconsin in under-reporting republican support and overstating democrat support. That both states are indicating a republican advantage, before looking at previous polling errors, it seems appropriate to throw them into the repubican slot. R-306 and D-216.

Nevada you say. Nevada (6) is currently leaning R, but previous history, indicates under-reporting democrat support. Still a slight edge for R, but very slight. Now it is R-306, D-216, and T-6.

Then there is the curious case of Minnesota (10), which has historically been polled with Rs being underestimated, and Ds being overestimated, compared to general election. That polling is currently very narrow, which could possibly be a problem for Dems.

R-306, D-216, and T-16.

There is a lot of time left to change things. Of course, there is always time to change things... until time runs out. 

I will resist the temptation to post frequently, but if those EVs change, then I might jump in.  


Thursday, January 4, 2024

This Week in Petroleum Summary January 4th, 2024 per EIA.GOV

This week's full report.


Consumption slid, although not sure if a downward trend is developing. Last year's data would indicate a downward direction for a couple more weeks. 

Pricing seems to be at a plateau, with very small movements in either direction.

The overall picture...

While crude inventories slipped (-5.5M barrels) from last week, the Gasoline and Distillate inventories rose by 10M barrels each. Even the SPR increased by 1M barrels.

For those interested, the exports of Crude, Petroleum Products, Including Gasoline has far outweighed the imports, by this much, since March, 2022.


All is well, until things become unwell! 

That's my story, and I am sticking to it!


1-17-2025 Week In Review

Laugh of the week Watching Sky News and a lady proclaimed that social media sites should be held to the same strict standards as newspaper p...