Saturday, May 27, 2023
Review of PCE, GDP, etc., for end of May, 2023
Natural Gas Inventory Report, May 27, 2023
The Energy Information Administration released their weekly report on Thursday.
Prices in all West Coast markets declined yesterday from last Wednesday. The price at PG&E Citygate in Northern California fell 95 cents, down from $4.13/MMBtu last Wednesday to $3.18/MMBtu yesterday. The price at SoCal Citygate in Southern California decreased 33 cents from $2.58/MMBtu last Wednesday to $2.25/MMBtu yesterday. The price at Sumas on the Canada-Washington border fell 21 cents from $1.83/MMBtu last Wednesday to $1.62/MMBtu yesterday. Natural gas consumption in the Western region decreased by 1% (0.1 Bcf/d), which was led by a 4% (0.1 Bcf/d) decrease in consumption in the electric power sector. In Northern California, PG&E’s total gas in storage was 12.6 billion cubic feet (Bcf) as of May 23, up from 5.8 Bcf on May 1.
Select inventories of EU and UK...
Prices continue to fall on the UK and EU markets. The UK spread of futures is annually at £1,453.60 ~ £2,191.06, with OFGEM setting the cap at £2,074. That cap is consistent with NatGas prices through October, with an added 3.7% cushion.
Wednesday, May 24, 2023
Gasoline consumption per latest EIA data, May 24, 2023
Gasoline prices (per AAA) edged up this week, from $3.532 to $3.561. One year ago the price had ballooned to $4.598
Consumption increased +0.2% from last week, and stands 1.5% above year ago numbers. (This is a four week moving average).
Crude and Petroleum Product Inventories - May 24 2023
Crude stocks dropped rather dramatically -12.4M barrels, from last week, and remains down -4.0% from the 5 year seasonal average. It should be noted the 5 year average includes the abnormal 2020 and 2021 number. Otherwise, the current inventory is nearly +1.0% above normal.
Distillates slid -500K; and Gasoline inventories slid -2.0M barrels. The SPR fell another -1.6M barrels.
Friday, May 19, 2023
Natural Gas Inventory Report, May 19, 2023
The Energy Information Administration released their weekly report on Thursday.
Wednesday, May 17, 2023
Gasoline consumption per latest EIA data, May 17, 2023
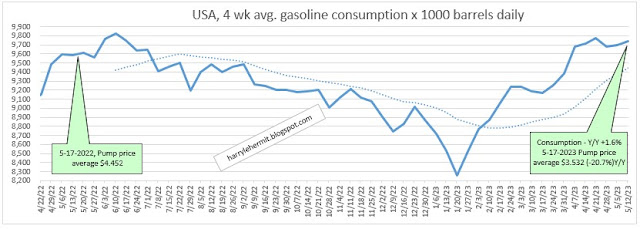
Gasoline prices were (per AAA) were flat this week, from $3.531 to $3.532. So okay... one tenth of once cent more. A year ago, the price had ballooned to $4.452.
Consumption increased +0.4% from last week, and stands 1.6% above year ago numbers. (This is a four week moving average).
Crude and Petroleum Product Inventories - May 17 2023
Today's EIA.gov report.
Crude stocks jumped +5.0M barrels, from last week, and remains down -1.7% from the 5 year seasonal average. It should be noted the 5 year average includes the abnormal 2020 and 2021 number. Otherwise, the current inventory is nearly +2.8% above normal.
Distillates held steady; and Gasoline inventories slid -1.3M barrels. The SPR fell another -2.4M barrels.
Tuesday, May 16, 2023
5-16-23, Advance Retail Sales Report for April
Advance Monthly Sales for Retail and Food Services, April 2023.
Advance estimates of U.S. retail and food services sales for April 2023, adjusted for seasonal variation and holiday and trading-day differences, but not for price changes, were $686.1 billion, up 0.4 percent (±0.5 percent)* from the previous month, and up 1.6 percent (±0.7 percent) above April 2022. Total sales for the February 2023 through April 2023 period were up 3.1 percent (±0.4 percent) from the same period a year ago. The February 2023 to March 2023 percent change was revised from down 0.6 percent (±0.5 percent) to down 0.7 percent (±0.2 percent).
Retail trade sales were up 0.4 percent (±0.5 percent)* from March 2023, and up 0.5 percent (±0.5 percent)* above last year. Nonstore retailers were up 8.0 percent (±1.2 percent) from last year, while food services and drinking places were up 9.4 percent (±2.5 percent) from April 2022.
As always, these figures are not adjusted for inflation, so +1.6% above year ago levels, when inflation adjusted comes down to something like -3.2%.
Now for those revisions. Yes, April was up 0.4% from previous month, which was revised from -0.6% to -0.7%. Doesn't seem bad, until you look at the previous month's revisions.
Friday, May 12, 2023
Natural Gas Inventory Report, May 12, 2023
The Energy Information Administration released their weekly report on Thursday.
Thursday, May 11, 2023
Producer Price Index May 2023 release for April Data.
The BLS has released the April Producer Price Index Report. (historical releases)
The Producer Price Index for final demand advanced 0.2 percent in April, seasonally adjusted, the U.S. Bureau of Labor Statistics reported today. Final demand prices fell 0.4 percent in March and were unchanged in February. On an unadjusted basis, the index for final demand moved up 2.3 percent for the 12 months ended in April.
In April, 80 percent of the rise in the index for final demand is attributable to a 0.3-percent increase in prices for final demand services. The index for final demand goods advanced 0.2 percent.
Prices for final demand less foods, energy, and trade services rose 0.2 percent in April after inching up 0.1 percent in March. For the 12 months ended in April, the index for final demand less foods, energy, and trade services increased 3.4 percent.
Wednesday, May 10, 2023
Gasoline consumption per latest EIA data, May 10, 2023
Gasoline prices were (per AAA) were down -5.5¢ this week, to $3.531. A year ago, the price had ballooned to $4.374. I eventually projected a -10.2¢ decrease, and missed the mark. Those falling prices might be over, although not a sharp rise seems in the offing. Maybe +2.6¢ for the coming week.
Consumption increased +0.2% from last week, and stands 1.1% above year ago numbers. (This is a four week moving average).
Crude and Petroleum Product Inventories - May 10 2023
Today's EIA.gov report.
Crude stocks jumped +2.9M barrels, from last week, and remains down -2.6% from the 5 year seasonal average. It should be noted the 5 year average includes the abnormal 2020 and 2021 number. Otherwise, the current inventory is nearly +2.2% above normal.
Distillates fell -4.2M Barrels; and Gasoline inventories slid -3.1M barrels. The SPR fell another -2.9M barrels.
BLS releases latest Real Earnings... May 10, 2023
The BLS has released the latest Real Earnings Report.
Real average hourly earnings for all employees increased 0.1 percent from March to April, seasonally adjusted, the U.S. Bureau of Labor Statistics reported today. This result stems from an increase of 0.5 percent in average hourly earnings combined with an increase of 0.4 percent in the Consumer Price Index for All Urban Consumers (CPI-U).
Real average weekly earnings increased 0.1 percent over the month due to the change in real average hourly earnings combined with no change in the average workweek.
Real average hourly earnings decreased 0.5 percent, seasonally adjusted, from April 2022 to April 2023. The change in real average hourly earnings combined with a decrease of 0.6 percent in the average workweek resulted in a 1.1-percent decrease in real average weekly earnings over this period.
Now for some charts...
This chart indicates the hourly earnings are back to December wages, which is one penny below February, 2020.
CPI Latest DATA results, May 10, 2023
The BLS report was released this morning and it was a shade below consensus estimates. (historical releases)
The Consumer Price Index for All Urban Consumers (CPI-U) rose 0.4 percent in April on a seasonally adjusted basis, after increasing 0.1 percent in March, the U.S. Bureau of Labor Statistics reported today. Over the last 12 months, the all items index increased 4.9 percent before seasonal adjustment.
The index for shelter was the largest contributor to the monthly all items increase, followed by increases in the index for used cars and trucks and the index for gasoline. The increase in the gasoline index more than offset declines in other energy component indexes, and the energy index rose 0.6 percent in April. The food index was unchanged in April, as it was in March. The index for food at home fell 0.2 percent over the month while the index for food away from home rose 0.4 percent.
For the record, some rounding makes this appear much better. Last month's 5.0% was 4.98%, and this month's 4.9% is 4.93%.
The all items less food and energy index rose 5.5 percent over the last 12 months. (5.52%)
That compared to 5.6%, last month. (5.59%)
My own personal CPI...Saturday, May 6, 2023
West Coast Natural Gas Inventories improving, but still below seasonal norms.
The Energy Information Administration released their weekly report on Thursday.
Wednesday, May 3, 2023
Gasoline consumption eases per latest EIA data, May 3, 2023
Gasoline prices were (per AAA) were down -6.0¢ this week, to $3.586. A year ago, the price had ballooned to $4.204. I eventually projected a -5.6¢ decrease, then backed off. However, it is going the right direction and appears to trending even lower.
The consumption slipped -0.9% from last week, and stands 2.0% above year ago numbers. (This is a four week moving average).
Crude and Petroleum Product Inventories - May 03 2023
Today's EIA.gov report.
Crude stocks dropped -1.3M barrels, from last week, and pulled it down -2.6% from the 5 year seasonal average. It should be noted the 5 year average includes the abnormal 2020 and 2021 number. Otherwise, the current inventory is nearly +2.8% above normal.
Distillates fell -1.2M Barrels; and Gasoline increased +1.7M barrels. The SPR fell another -2.0M barrels.
A Bit of Update on the Energy Market, and a Few Political Opinions.
The winter weather is the likely culprit for the drop in overall consumption. Only time will tell. The overall inventories are still in goo...

-
Reviewed this weeks EIA report and observed the current status of inventories. Oddly, although domestic consumption is down from last year,...
-
Today's EIA.gov report . Crude stocks up again, +7.6M barrels, from last week; Distillates up +2.7M Barrels; and Gasoline slid -1.9M b...
-
This week's full report . Gasoline pump prices rose +1.4¢ for the week, but continues below year ago levels, by -3.2¢, or -1.2%. Days...


