Thursday, March 14, 2024

3/14/2024, Advance Retail Sales Report for February Data

Advance Monthly Sales for Retail and Food Services, February Report.

Advance estimates of U.S. retail and food services sales for February 2024, adjusted for seasonal variation and holiday and trading-day differences, but not for price changes, were $700.7 billion, up 0.6 percent (±0.5 percent) from the previous month, and up 1.5 percent (±0.7 percent) above February 2023. Total sales for the December 2023 through February 2024 period were up 2.1 percent (±0.5 percent) from the same period a year ago. The December 2023 to January 2024 percent change was revised from down 0.8 percent (±0.5 percent) to down 1.1 percent (±0.4 percent).

Of course the previous 2 months were revised downward...


The result in inflation adjusted sales, looked like this...


Since the pre-covid timing, the inflation report...

The average for the monthly sales starting from March 2021...


The trend is undeniably downward. 

It's not all gloom and doom, as there are areas seemingly on the uptick. Read the report and download the data, to see those areas.


Tuesday, March 12, 2024

BLS Data Dump. CPI - March 12th, 2024

First up is the BLS Report for CPI...(historical releases

The Consumer Price Index for All Urban Consumers (CPI-U) increased 0.4 percent in February on a seasonally adjusted basis, after rising 0.3 percent in January, the U.S. Bureau of Labor Statistics reported today. Over the last 12 months, the all items index increased 3.2 percent before seasonal adjustment.

The index for shelter rose in February, as did the index for gasoline. Combined, these two indexes contributed over sixty percent of the monthly increase in the index for all items. The energy index rose 2.3 percent over the month, as all of its component indexes increased. The food index was unchanged in February, as was the food at home index. The food away from home index rose 0.1 percent over the month.

While the chart below shows the past 12 months, it should be noted the end of 2022 also saw a downward trend, prior to 2023 rises. The February number continues the 2023 1st quarter upward swing.

On the other hand, my own personal CPI rate has continued upward, albeit not as high as the CPI-U.

That is 2.5% annual, with another sharp 0.4% increase for February. The reason last month was the medical category, but is more evenly spread for this month. My worse fear being that my personal rate is edging up towards the CPI-U rate, which seems mired in a narrow range.

The R-CPI-E did ease from last month's annual of 3.5% to this month's annual of 3.4%. The month to month was still at +0.6%, but is more of a rounding issue. Last month was +0.635% and this month at +0.554%.

Across the board resulted in this picture...

As for Real Earnings.

Not such a good report, as indicated by this graph...

While the downward spike of 3¢ per hour might not seem large, it follows downward revisions in two previous months. Revisions are a normal part of the process, but a troubling trend is frequency of downward revisions in previous month's data. This tends to enhance the belief of manipulation in an election year.

This follows the pattern of jobs, GDP, etc. Not a real confidence builder, imo.


Wednesday, March 6, 2024

This Week in Petroleum Summary March 6th, 2024 per EIA.GOV

This week's full report

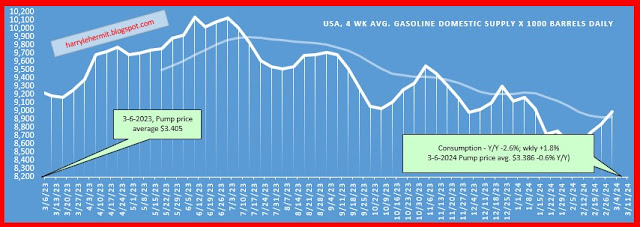
Consumption continues to rise on a weekly basis, but not yet at last year's seasonal levels.


And as can be expected... pump prices are also rising...


Refinery operational levels continue below year ago averages.


Crude inventories rose +1.4M barrels; distillates down -4.1M barrels; gasoline down -4.5M barrels.

For those interested, the exports of Crude, Petroleum Products, Including Gasoline has far outweighed the imports, by this much, since March, 2022.


The current crack spread has shot up since last week to $29.43, with gasoline jumping to $17.02 from last week's $10.89. Distillates at $12.41, compared to last week's $12.01.

This likely translates to additional upward pressure on gasoline, with diesel remaining relatively flat. 

Saturday, March 2, 2024

A Foray into the 2024 Presidential Election, Part XI

I said I would not post another election article, unless there were changes. I guess I lied.


The national polls continue to be tight, with a slight edge to republicans. Late in 2016, it was a 4 point lead for Clinton and resulted in a 2 point lead in actual votes. 2020 saw a significant lead of about 9 points for Biden, which ended with a 4.5 point vote lead for Biden.

Of course the polls were wrong in each case. Polls seem to vary in accuracy from state to state. It could be that down ballots affected the actual vote vs polls. A dem voter in a deep red state may have seen nothing of significance on the down ballot and opted to avoid voting. 

Similarly, a weak down ballot might have discourage a dem voter from going to the polls, when they felt assured of victory for their candidate.

There are many reasons for polls not fully reflecting the actual votes. Some voter2 might be hesitant to provide their real intentions, due to a number of factors.

In any case, some states polls have been reflective of eventual outcomes. The VAR (variance) in the above chart indicates the difference between polls and outcomes. Those numbers hold largely true back to the 2000 election.

Arizona would be an example of a state that has very accurate polls... historically. Why? I don't know. The actual poll numbers might not reflect the actual vote tally, BUT the variance is undeniable. Arizona is almost always in the very accurate range, with the variance near zero.

Wisconsin is on the other end of the spectrum, with a red 6.5% variance. Meaning the margin of eventual tally is favorable to republicans by 6.5%. Thus a poll lead of 4.4% for republicans... becomes a very hard lean in favor of republicans.

When all is said and done, the current projected EV tally is REP-293, DEM-216, and TU-29, with the TUs favoring the REP.

There are 248 days until judgement day. A lot can change in that length of time... AND a lot needs to change!

Once again, I will attempt to avoid futher commenting until something does change.

Wish me luck!

Thursday, February 29, 2024

Review of January 2024 data, 4Q GDP Revision, PCE and personal income

The monthly summary...


The downward shift in inflation continues across the board, with the exception of my price index, which is more about healthcare than any other weightings.

There were modest revisions in the PCE report, which are highlighted in Red.


I have made much of government spending on the GDP, but historically... not so abnormal (all charts from 2000Q1 onward...


A bit grainy in the upload, but trends are evident. The worrying factor is the trade deficit, while showing a bit of improvement the past few months, is still staggering compared to 10 years ago.

Bored silly, so will leave it there. 


Wednesday, February 28, 2024

This Week in Petroleum Summary February 28th, 2024 per EIA.GOV

This week's full report

Upward movement in consumption continues...


Pump prices are beginning to drift upward...

Refinery levels continue to ease for a 4 week running average.


Crude inventories rose +4.2M barrels; distillates down -510K barrels; gasoline down -2.9M barrels.

For those interested, the exports of Crude, Petroleum Products, Including Gasoline has far outweighed the imports, by this much, since March, 2022.


Distillates per barrel are where the most profit for refineries lie. The current crack spread is $22.91 per barrel, with $12.01 coming from distillate and $10.89 from gasoline. 

Those figures are down compared to last week. It is notable the drop in the diesel portion, which would suggest lessening demand, which is also seen in a slight downward trajectory in pump prices, as well as a slight decrease in refinery output, despite higher crude pricing.

Gasoline pump prices are edging up, which can be reflected in upward crude prices, lessening refinery operation, etc. 

The relationship between diesel and gasoline should not be overlooked.


Saturday, February 24, 2024

Comparison of Inflation in selected countries- February, 2024 Edition

With the United Kingdom, Canada and EUstats release of December data, I have updated my comparison graph. [Note, the USA(EU method) is directly from Eurostat.]

The rates are indeed about the same across this spectrum.

However, it was NOT always the same, and the reasons for that are different, despite the gullible people fawning over, and blindly following their particular political puppeteer.


Done for this month.


Comparison of Inflation in selected countries- September, 2024 Edition

With the United Kingdom, Canada, and EUstats release of June data, I have updated my comparison graph.  [ Note, the USA(EU method) is direct...